
Economic Data
U.S.
Great Recession was Worse than Thought
GDP Growth Slows... Spike in Business Investment
Q1 GDP Revised Up One Full Point
Leading Indicators... More Fed Please
Durable Goods Off
Consumers Getting Realistic
Chicago Fed Details a Slowing Economy
Non-U.S.
Japanese Exports Halfway There
Signs of Life in Europe
The British are Coming... Back
Asset Class Performance
End of the World Trade Unwind
Earnings Season has Been Strong
Home Prices Jumped in May... Test Comes Next Month
Got Yield?
Europe's Pecking Order
Existing Home Sales Under Pressure
And your video of the week Spoon with 'Jonathon Fisk' (who happens to be opening for Arcade Fire at next week's show at MSG, which I will be attending):
Friday, July 30, 2010
EconomPics of the Week (7/30/10)
Great Recession was Worse than Thought
I detailed that Q1 GDP was revised up one full point... great news right?
Not when past quarters have been revised down. Per Calculated Risk:
The recession was worse in 2008 than originally estimated.Q1 2010 was revised up, but Q3 and Q4 2009 were revised down. So the recovery is a little weaker than originally estimated.

On a cumulative basis over this time frame, the current level of GDP is 0.8% smaller than previously estimated.

Source: Calculated Risk
Q1 GDP Revised Up One Full Point
Changes to Q1 were extremely broad since the numbers went "final" a month back, GDP jumped a full point from 3.7% to 2.7% due to a large jump in non-residential investment and a huge spike in inventory build (the question is who will be buying) offset by a rather large drop in service consumption.
Click for larger image
Source: BEA
GDP Growth Slows... Spike in Business Investment
Bloomberg details:
Growth in the U.S. slowed to a 2.4 percent annual rate in the second quarter, less than forecast, reflecting a larger trade deficit and cooler consumer spending.
The increase in gross domestic product compared with a median forecast of 2.6 percent of economists surveyed by Bloomberg News and follows an upwardly revised 3.7 percent pace in the first quarter that showed a jump in inventories, according to figures from the Commerce Department today in Washington. Business investment climbed at the fastest rate since 1997.
Click for Larger Image

Source: BEA
Thursday, July 29, 2010
End of the World Trade Unwind
High beta trades have done extraordinarily well in July as apparently the world wasn't ending.
What happens now will be interesting... that toe that I dipped in last month is getting ready to dry off for a bit.
Source: Yahoo
Wednesday, July 28, 2010
Earnings Season has Been Strong
Bespoke Investment Group (hat tip Abnormal Returns):
S&P 500 stocks have been beating earnings estimates at a much higher rate. Through yesterday, 78.8% of S&P 500 companies had beaten expectations. Interestingly, the high beat rate for the S&P 500 hasn't translated into better stock performance.

Source: S&P
Durable Goods Off
ABC News details:
New orders for long-lasting U.S. manufactured goods unexpectedly fell for a second straight month in June, posting their largest decline since August, according to a government report on Wednesday that was further evidence economic growth cooled in the second quarter.While not good news, to me this is just noise. Looking at the chart below, which shows the month over month change and three month change by durable good type, we can see that most sectors that fell, fell from sectors that have rebounded over the past three months (transportation equipment, capital goods, machinery, and the overall index).
The Commerce Department said durable goods orders fell 1.0 percent after a revised 0.8 percent drop in May.
Analysts polled by Reuters had forecast orders increasing 1.0 percent in June from May's previously reported 0.6 percent fall. But non-defense aircraft orders tumbled 25.6 percent in June after falling 30.2 percent the prior month. Overall orders were also pulled down by bookings for computers and electronic products, which saw their largest decline since October.

My take? Things were never really as strong as market participants hoped and they aren't as weak as some may now think...
Source: Census
Tuesday, July 27, 2010
Consumers Getting Realistic
The Conference Board details:
Says Lynn Franco, Director of The Conference Board Consumer Research Center: “Consumer confidence faded further in July as consumers continue to grow increasingly more pessimistic about the short-term outlook. Concerns about business conditions and the labor market are casting a dark cloud over consumers that is not likely to lift until the job market improves. Given consumers’ heightened level of anxiety, along with their pessimistic income outlook and lackluster job growth, retailers are very likely to face a challenging back-to-school season.”

Source: Conference Board
Home Prices Jumped in May... Test Comes Next Month
Reuters details the jump in May, but the test comes in June post-tax credit:
U.S. single-family home prices rose more than expected in May, still reflecting robust spring sales spurred by homebuyer tax credits, Standard & Poor's/Case Shiller home price indexes showed on Tuesday.Month over Month
The 20-city composite price index rose 0.5 percent on a seasonally adjusted basis in May after an upwardly revised 0.6 percent gain in April, topping the 0.2 percent rise forecast in a Reuters poll.
This was the second straight monthly rise after declines in the prior two months.

Six Month Change

Source: S&P
Update per reader Mike Hardy:
Case-Shiller is a 3-month average, posted with a 2-month delay.See you in August?
So this should read "home prices in March April and May showed some gains", and that should be placed in the context of the tax credits, and any more current data available which shows what is happening now, as it will easily predict what the C-S index looks like in October, when the C-S release includes June/July/August - post-tax-credit collapse...
Monday, July 26, 2010
Got Yield?
A month back I detailed that the aggregate bond index (i.e. the Barclays Capital Aggregate made up mainly of Treasuries, Corporates, and Agency MBS) hit an all-time low yield of 2.94%. One month later that looks lofty as the yield to worst hit 2.71%.
Aggregate Bond Index YTW by Sub-Sector
Source: Barclays Capital
Chicago Fed Details a Slowing Economy
Chicago Fed details:
The index’s three-month moving average, CFNAI-MA3, decreased to –0.05 in June from +0.31 in May. The CFNAI-MA3 suggests that growth in national economic activity returned veryclose to its historical trend in June after reaching its highest level since March 2006 in May. With regard to inflation, it indicates subdued inflationary pressure from economic activityover the coming year.
Production-related indicators made a contribution of –0.11 to the index in June, down from +0.61 in May. Industrial production edged up 0.1 percent in June after increasing 1.3 percent in May; manufacturing production declined 0.4 percent in June after increasing 1.0 percent in the previous month.

Source: Chicago Fed
Sunday, July 25, 2010
Japanese Exports Halfway There
Bloomberg details:
Japan’s exports rose faster than economists estimated, sustaining a boost to the economic recovery that may diminish as the yen strengthens.An increase shows that the global economy continues to recover, but (as always) the increase needs to be put in perspective. Current export levels are still only about halfway back to the level seen prior to the global economic crisis.
Shipments abroad advanced 27.7 percent in June from a year earlier, the Finance Ministry said today in Tokyo. The median estimate of 19 economists surveyed by Bloomberg was for 23.5 percent. From a month earlier, exports fell 1.8 percent.

The question is what happens going forward? Bloomberg details that following a strong rally in the yen in recent months, officials are concerned:
Japan’s currency climbed to a seven-month high against the dollar this month, prompting officials including Trade Minister Masayuki Naoshima to warn that its appreciation may hurt the recovery. The higher local currency threatens to erode the value of earnings of exporters such as Toyota Motor Corp.Currency can do wonders on a relative basis, but not when every nation intends to follow the same path. And this points to what I view as a huge problem... China, broader Europe, Japan, and the U.S. (to name a few) view exports as the key for future growth and a weaker relative currency as a huge driver of those exports.
“The yen has appreciated too much,” Koji Miyahara, chairman of shipping company Nippon Yusen K.K., said last week. “I’m hoping the yen will depreciate to a range of 95 to 100 to the dollar as soon as possible.”
But one nations increase in net exports (by simple math) is another nations net import. So... which nation will take all of these exports? I personally don't see many takers.
Source: Customs.GO
Friday, July 23, 2010
Europe's Pecking Order
Interesting stuff in the stress test results, outside of the results themselves. An example... the valuation haircuts used in the stress test on sovereign debt holdings. The absolute magnitude isn't nearly as interesting (to me) as the relative magnitude (i.e. Italy vs. the United Kingdom).
Source: Stress Test
The British are Coming... Back
Bloomberg details:
The British economy grew at the fastest pace in four years in the second quarter and German business confidence surged to a three-year high this month, indicating Europe’s recovery may be stronger than forecast.
U.K. gross domestic product rose 1.1 percent in the three months through June, almost twice as fast as the 0.6 percent gain predicted by economists in a Bloomberg News survey, the Office for National Statistics said in London today.

Source: Stats.UK
Thursday, July 22, 2010
Leading Indicators... More Fed Please
Bloomberg details:
The index of U.S. leading indicators fell 0.2 percent in June, the second decline in three months, signaling the world’s largest economy will cool.Stripping out interest rate spread and money supply (i.e. Fed controlled items), we have three straight months of decline for all other items.
The decrease in the New York-based Conference Board’s gauge of the prospects for the economy in the next three to six months compares with the median estimate for a 0.3 percent decline in a Bloomberg News survey of economists and follows a 0.5 percent gain in May.
Federal Reserve Chairman Ben S. Bernanke yesterday repeated his forecast for a “moderate” pace of growth even as he said the outlook remains “unusually uncertain.” Recent reports on housing, retail sales and the labor market have pointed to weakness in the economy as the second half begins.

Add caution on the fiscal front (i.e. state austerity measures) and I'm thinking we need some more monetary stimulus pronto...
Source: Conference Board
Existing Home Sales Under Pressure
CNN Money details:
Looking at the details we see the pace in the year over year increase has slowed (with no growth in the west).The National Association of Realtors reported that existing home sales fell last month to a seasonally adjusted annual rate of 5.37 million units, down from 5.66 million in May. Sales year-over-year were up 9.8%.
Analysts had expected existing home sales to fall to an annual rate of 5.09 million units, according to consensus estimates from Briefing.com.
June sales still reflect the impact of a popular $8,000 tax credit, which is due to expire in September after Congress extended the June 30 closing deadline.

The breakdown of sales by price range is also interesting. We see relative strength in the Northeast and it looks like much of the rebound has occurred in the upper tier markets, which most likely has participants that still have access to credit (I should also note that some of this is due to the decline in distressed sales).

Source: Realtor
Signs of Life in Europe
Marketwatch details:
The European Union statistics agency Eurostat said May industrial orders across the euro zone rose 3.8% compared to April and rose 22.7% compared to May 2009.
Economists had forecast a flat monthly reading and a 20% year-on-year rise. The agency, however, revised down the April rise to a 0.6% monthly increase and a 21.9% year-on-year rise.
The PMI figures, meanwhile, are among the most closely-watched data in the euro zone. The rise in the July data reflected an increase in the preliminary euro-zone manufacturing PMI to 58.3 in July from 57.2 in June, and a rise in the preliminary services PMI to 56.0 from 55.5.

Source: Eurostat
Sunday, July 18, 2010
EconomPics of the (Traveling) Week
The lack of posting (with the potential for some delayed posting) will continue through Wednesday as I am traveling (not work related for once).
Asset Classes
On the Relationship Between Earnings and Yield
More on Contango
Economic Data
Producer Prices Moderating
Empire State Manufacturing Slumps
Industrial Production Blips Higher
Chinese Economic Growth Slows... to 11.1%
Retail Sales: Small Purchases Up. Large Purchases Down
Budget Deficit: Going for Broke
Trade Imbalance Back
Small Businesses - Still Feeling the Pain
UK CPI in Check
Thursday, July 15, 2010
More on Contango
FT Alphaville with a great post "Is ‘cash for commodity’ the biggest trade in town?" explaining why commodity curves are in contango (demand from passive indexers) and the benefit to producers (a cheap source of financing). I have been sitting on the below post explaining how this translates into an investment in a passive commodity strategy (hint... not good) so I thought the time was right to finally post it.
Wikipedia explains roll yield, so I don't have to:
Said another way, backwardation means the futures price is below the current spot price (i.e. the curve is downward sloping), thus the investor gaining exposure via futures will outperform the underlying spot market (all else equal). Contango means the exact opposite situation (this was explained recently regarding the VIX ETN VXX in the EconomPic post When ETNs Attack). In addition, as explained by FT Alphaville, this negative drag is the "subsidized financing" received by commodity producers "selling" their commodities in the futures market.The roll yield is the yield that a futures investor captures when their futures contract converges (or rolls up) to the spot price in a backwardated futures market. The spot price can stay constant, but the investor will still earn returns from buying discounted futures contracts, which continuously roll up to the constant spot price.
Note that in case of a market in contango, the roll yield is negative - since the price of the futures contract trades higher than the spot price, and rolls down to converge towards the spot price.
How much of an impact does this have? Let's take a look at the impact via the excess roll yield of the S&P GSCI Commodity Index futures vs. spot.

As can be seen above, the futures market has consistently underperformed the spot market since mid-2004. By how much?

A lot...
Producer Prices Moderating
The decline in month over month PPI
Has fed into moderation of the year to year final goods figure

Source: BLS
Empire State Manufacturing Slumps
This is just one month of data, but this is an ugly report for those expecting a strong recovery. Of note... employment (slowing growth in number, decline in hours worked) and inventory (the inventory rebuild that drove the last 3 quarters growth appears to be over).
Source: NY Fed
Industrial Production Blips Higher
BusinessWeek details:
Industrial production in the U.S. unexpectedly rose in June as higher temperatures across the nation led to increased utility use.Looking at the longer term trend, the relative outperformer has actually been due to the surprise strength of the consumer (i.e. consumer goods). The area I am focusing on is business equipment, which has in fact rebounded sharply from what were massive lows. An increase in consumption going forward will likely need to come from an improved job market and investing in new equipment should be a sign that businesses view the economy in an improved light.
Factories, which led the economy out of the worst recession since the 1930s, are facing less pressure to boost production to rebuild inventories as consumer spending cools. Manufacturers will instead be able to count on gains in business investment that have spurred sales and earnings at companies such as Intel Corp.
“I don’t think the industrial sector just fell off a cliff,” Paul Ashworth, senior U.S. economist at Capital Economics Ltd. in Toronto, said before the report. “We’ve seen some pretty big gains over the last few months so I would characterize it more as giving back some of those gains. There’s still a lot to support for the industrial sector.”

Source: Federal Reserve
Wednesday, July 14, 2010
Chinese Economic Growth Slows... to 11.1%
Bloomberg reports that Chinese economic growth "eased" to 11.1% in the first half (must be nice) and inflation cooled. In other news, everything in China is absolutely perfect (in every way):
China’s economic growth eased to 11.1 percent in the first half after the government succeeded in tempering credit expansion, investment spending and property speculation.And some details backing that "slow" growth.
The pace compares with an 11.9 percent gain in January-March from a year earlier. Inflation cooled to 2.9 percent in June, the statistics bureau also reported in Beijing today. Industrial output rose a less-than-estimated 13.7 percent.
The figures signal a diminishing risk of economic overheating, and give Premier Wen Jiabao more room to scale back restrictions on bank lending in coming months. A deeper downturn in the nation forecast to account for one third of global growth this year would compound risks for a world recovery already clouded by European budget cuts and limited American job gains.

Source: Conference Board
Retail Sales: Small Purchases Up. Large Purchases Down.
The WSJ details:
U.S. retail sales tumbled a second straight time in June, falling more than expected in a sign consumer spending is slowing and draining steam from an economy saddled with high joblessness. Sales decreased 0.5%, the Commerce Department said Wednesday. Economists surveyed by Dow Jones Newswires had forecast a 0.3% decline.Looking at the components of the release, we see an interesting bifurcation...
The report was mixed, with some merchants reporting increases and others recording decreases. Excluding auto and gas sales, retail sales rose 0.1%. The bigger-than-expected drop in the headline number followed an upwardly revised 1.1% drop in May. Originally, May sales were estimated falling 1.2%.
Retail sales is a pivotal indicator of consumer spending, which makes up much of economic activity in the U.S. The second decline in a row dealt a blow to an economy with an unemployment rate of 9.5%, and will increase concerns about the recovery.
Down were:
- Autos (data which was already available comparing the strength in June to May)
- Gas (a function of the decline in the price of oil)
- Furniture / building materials (crash in new home sales)
- Sporting Goods (no clue)
- Electronics (iPhone?)
- Clothing
- Health stores
- Restaurants (a good sign?)

Source: Census
Tuesday, July 13, 2010
On the Relationship Between Earnings and Yield
Trader's Narrative (hat tip Abnormal Returns) has an interesting piece from Wayne Waley (CTA) about the relationship between S&P earnings and interest rates. His conclusion following an analysis of data since 1970:
During periods of extremely low interest rates, stocks can reasonably be expected to sell in a P/E range somewhat higher than the historic 10-20 range. It is difficult for me to envision the P/E’s going to single digits during this bear market cycle (as has been the case in many previous inflationary bear markets) - unless the single digit P/E’s come far down the road when interest rates are much higher (above 5%).Based on this conclusion, he believes stocks are trading at a low end of the range. There is an obvious flaw in his analysis, one that even Wayne points out in his devil's advocate 'argument that a bear would make':
If you go back to the 1950s or 1930’s you can find cases where the above interest rate/earnings relationship fails.
Actually, if you go to any point before 1970 (going back to 1910)... there were no other extended periods with a strong relationship between the two.
Earnings vs. Rates (in this case the 10 year interest rate rather than the blend)

Ten Year Rolling Correlation Between Earnings Yield and Ten Year Treasury Rates

Two questions I personally want answered:
- What happened in 1970 that would have caused the relationship between the two (initial thoughts include demographics [i.e. baby boomers], the growth of retail investing, and the increased debt added throughout the financial system)?
- Whatever the answer to #1, will that/those relationship(s) remain in an economy that faces deleveraging and a rebalancing within the global economy?
Source: Irrational Exuberance
Budget Deficit: Going for Broke
The Good = An Improvement
BusinessWeek details:
The U.S. government posted a smaller budget deficit in June compared with the same month last year as the economic recovery brought in more tax revenue.The Bad = The Levels
The excess of spending over receipts fell to $68.4 billion last month from $94.3 billion in June 2009, according to a Treasury Department report issued today in Washington. It was the 21st consecutive shortfall. For the fiscal year to date, the budget deficit totaled $1 trillion compared with $1.42 trillion during the prior year to date.
Treasury receipts in the first 9 months of fiscal year 2010 equaled $1.6 trillion. Just about the same level as in 2001, when spending was 54% of current levels.

Source: Treasury
Trade Imbalance Back
Marketwatch details:
The U.S. trade deficit widened to the highest level in 18 months in May as imports and exports alike bounced back after declines in April, government data showed Tuesday. The deficit, the difference between the nation's exports and imports, reached $42.3 billion in May from $40.3 billion in April, the Commerce Department said.
It marked the largest trade gap since November 2008. The one-month worsening in the deficit is the biggest since February. The widening of the deficit confounded expectations. Analysts surveyed by MarketWatch had expected the May gap to narrow to $38.8 billion.
The larger-than-expected trade gap may cause economists to reduce their forecasts for second-quarter gross domestic product. A worsening trade gap is a drag on growth.

For more detail on the "why" of this increase, Michael Pettis has a great post explaining it here. The high level summary:
I have little doubt that as the US trade deficit rises, a lot of finger-wagging analysts will excoriate US households for resuming their spendthrift ways, but of course the decline in US savings and the increase in the US trade deficit will have nothing to do with any change in consumer psychology or cultural behavior. It will be the automatic and necessary consequence of the capital tug-of-war taking place abroad.
Source: Census
Small Businesses - Still Feeling the Pain
The WSJ details:
The National Federation of Independent Businesses said its Small Business Optimism Index dropped 3.2 points to 89.0 last month, more than erasing the modest 1.6-point gain it saw in May. The report, which was compiled by NFIB Chief Economist William Dunkelberg, described the decline as “a very disappointing outcome.”
In past periods following a recession, the NFIB index typically has risen back above 100 within a quarter or two of the trough in economic activity as measured by the National Bureau of Economic Research.That hasn’t been the case during this recovery. The index hasn’t broken above 93 in any month since January 2008 when the economy was in the early stages of recession, even though the NBER is expected to eventually date the beginning of the recovery in the third quarter of last year.
In 23 of those past 30 months, readings have come in below 90, an unprecedented result in the survey’s history, the NFIB said.

Source: NFIB
UK CPI in Check
UK inflation was an area of my focus due to the large depreciation of the Pound, importance of the banking sector in the overall economy, and quantitative easing pursued. Even after all of that... inflationary pressures seem to have stalled (for the time being at least). Daily Markets details:
U.K. annual inflation slowed in June on fuel prices, suggesting that the central bank will keep the interest rate at the current level well into 2011.
Annual inflation slowed to 3.2% in June from 3.4% in May, data from the Office for National Statistics showed Tuesday. Inflation slowed for the second straight month. Still, the figure is above the central bank’s 2% target. Economists were expecting the annual rate to slow to 3.1%.
Falling petrol and diesel prices are by far the main drivers to the downward pressure to consumer price annual inflation between May and June, the ONS said. At the same time, the main upward pressures to inflation were the sharp rises in air fares and increases in insurance premiums. Clothing and footwear prices recorded the biggest drop for June.
To underpin the fragile economy amid severe fiscal consolidation, the Bank of England had left its key interest rate unchanged at a historic low and maintained the size of the quantitative easing at GBP 200 billion on July 8. The central bank is more likely than not to keep interest rates down at 0.50% into 2011 as recovery remains bumpy and gradual with major fiscal tightening and the Eurozone’s problems posing serious threats to UK growth prospects, said IHS Global Insight’s Howard Archer.

Source: Stats.Gov.UK
Friday, July 9, 2010
EconomPics of the Week (7/9/10)
I’m going to claim a solid week at EconomPic. I liked my posts (especially considering the shortened week / loads of travel) and made some pretty nice $$ / got lucky combining this post and this post.
Asset Classes
Things That Make You Go Hmmm.....
Earnings Jump... Cause for Economic Concern?
Hedge Funds Remain Under Pressure
Equities for the LOOOOONNNNGGGG Run
Economic Data
How is Spending Still Strong?
Consumer Credit Freefall
ISM Services: Slow Growth
Employment
The Employment Depression
The Aussie Miracle Continues
Where are those jobs at?
Bron Bron... a Go Go
And in honor of some good news coming out of Asia and US markets... Descendents with Hope (please tell me I have one reader who grew up listening to these guys):
How is Spending Still Strong?
Since Lehman collapsed in September 2008, consumption has remained surprisingly strong in the face of high unemployment (thus lower wages), lower asset values (less ability to tap home or 401k for spending), and a collapse in consumer credit.
How? The government! Less taxes and higher transfer payments (i.e. unemployment / welfare benefits).
Bron Bron... a Go Go
After seeing one of the most surreal letters imaginable from a boss to a former employee (in this case Cavs owner Dan Gilbert to NBA superstar Lebron James) is it any wonder he left? Here is a sampling (but imagine this hatred in the form of comic sans, which I guess Dan didn't realize was a font meant for 5 year old birthday cards):
This shocking act of disloyalty from our home grown "chosen one" sends the exact opposite lesson of what we would want our children to learn. And "who" we would want them to grow-up to become.
But the good news is that this heartless and callous action can only serve as the antidote to the so-called "curse" on Cleveland, Ohio.
And he somehow got more childish during a follow up phone interview (via ESPN):
"It's not about him leaving. It's the disrespect. It's time for people to hold these athletes accountable for their actions. Is this the way you raise your children? I've been holding this all in for a long time."
Gilbert said James quit on the Cavs during their second-round series against the Boston Celtics, who rallied from a 2-1 deficit to eliminate Cleveland. "He quit," Gilbert said. "Not just in Game 5, but in Games 2, 4 and 6. Watch the tape.
The Boston series was unlike anything in the history of sports for a superstar."
Good luck not needing to overpay any player by 10% on a going forward basis to play for you Dan!
The best thing about this move (outside of getting to watch one of the best players EVER with teammates who can actually play) has been the reaction I've witnessed from a sampling of friends. New Yorkers have called it a shame for the parity of the game (this mainly coming from Yankees fans!) and former Ohio residents calling him a sell-out (but these former Ohio residents did exactly what he did - they moved for new opportunity, a better job, new environment, and [perhaps] to get away from a disasterous boss).
And they are not alone... Dan's "lesson for Cleveland's children" has been ignored by local residents for 90 years (below is a chart of Cleveland's population and Cleveland's population as a percent of total US population).

Why should this be any different for Lebron, a 25 year old who has lived in the same area his entire life and has the chance to do something different?
Source: InfoPlease
Thursday, July 8, 2010
Consumer Credit Freefall
BusinessWeek details:
Consumer borrowing in the U.S. dropped in May more than forecast, a sign Americans are less willing to take on debt without an improvement in the labor market.Borrowing that’s increased twice since the end of 2008 shows consumer spending, which accounts for about 70 percent of the economy, will be restrained as Americans pay down debt. Banks also continue to restrict lending following the collapse of the housing market, Fed officials said after their policy meeting last month.
“The trend in consumer deleveraging is clear as credit has declined 11 of the last 13 months,” Joseph LaVorgna, chief U.S. economist at Deutsche Bank Securities Inc. in New York, said in a note to clients. “Credit card debt continues to be paid down at a heady pace.”
The key in the chart below is the blue line (total). Notice that besides a blip in the early 90's overall levels of consumer debt went one direction for 60+ years and we have never seen both revolving (i.e. credit cards) and non-revolving debt decrease (let alone crash) simultaneously.

Source: Federal Reserve
Things That Make You Go Hmmm.....
In my post regarding the recent jump in earnings (go here), reader Steve Hamlin commented:
Jake - your 100 year S&P500 E/P chart would be even more interesting if you also showed *real* stock yield (against some inflation metric), or subtract out an investment grade spread. One could argue that a lot of the difference in E/P over time is due to the base interest rate at the time.I took his advice and took the earnings yield from that post and subtracted out the yield of the ten year treasury to see the historical relative attractiveness of equities (red) and the cyclically adjusted earnings yield (i.e. 1 / Robert Shiller's CAPE) less the ten year to see a smoothed version (blue).

The results are rather staggering. For most of the period since the early 1980's, the earnings yield was actually below that of the 10 year treasury (this explains why equities have not done well on a relative basis over that time frame [see here] as all excess return had to come from growth in earnings, rather than earnings itself).
Just as interesting, is how cheap equities appear on a relative basis to treasuries at this time on a non-cyclically adjusted basis IF (the big question) they are sustainable.
Source: Irrational Exuberance
Earnings Jump... Cause for Economic Concern?
The Good: Earnings are up.
As Doug Kass detailed Wednesday morning (with what appears to be some great timing), this may be reason to believe that stocks have hit bottom for the year:
Trading at around 11 times earnings, stocks are fairly inexpensive, says Kass. He notes stocks generally trade at around 15 times future earnings, and even higher in periods of tame inflation and low interest rates, as we're currently experiencing.Rather than P/E ratio, below is E/P (i.e. earnings yield) of the S&P 500 going back 100 years (note that earnings yield appears to be at a 20 year high).

The Bad: Earnings are up.
The important question is how these earnings have come about. We all know that recent earnings have ratcheted higher due to reduced costs (job cuts, lack of investment, cheap financing) rather than top line growth. In other words, executives for public firms have caught up with the "buy, strip, and flip" nature of private investors. Yves Smith and Rob Parenteau detail the impact on the "actual" economy:
The big culprit in America is that public companies are obsessed with quarterly earnings. Investing in future growth often reduces profits short term. The enterprise has to spend money, say on additional staff or extra marketing, before any new revenues come in the door. And for bolder initiatives like developing new products, the up front costs can be considerable (marketing research, product design, prototype development, legal expenses associated with patents, lining up contractors). Thus a fall in business investment short circuits a major driver of growth in capitalist economies.And a similar story from the Chicago Tribune, Corporate Spending Good for Economy, but Bad for Profits, with a focus on the analyst community.
But even optimistic analysts, those who have ruled out a double-dip recession and see growth continuing at a modest pace, are wary. Some are raising concerns that companies will fall short on the profits investors are expecting, and they think the recent sell-off in the market comes from investors afraid to wait.Source: S&P / Irrational Exuberance
The cautious stance is not merely a symptom of global economic worries. Rather, some analysts contend that companies now must spend more money if they are to increase profits at levels that will satisfy investors. Yet, if they are spending more, and a weak economy stifles sales, that spending could backfire, leaving companies with disappointing profits and disappointed investors.
Wednesday, July 7, 2010
The Aussie Miracle Continues
As I've stated before, Australia is:
A commodity driven economy that has a close proximity to one of the world's fastest growing / largest commodity importing economy (China).Bloomberg details the results:
Australian job growth capped the best quarter in almost four years in June, stoking the nation’s currency and stocks and heightening odds that the central bank will have to resume boosting interest rates.
The 45,900 increase last month exceeded all 22 forecasts in a Bloomberg News survey, a statistics bureau report showed in Sydney. The jobless rate held at 5.1 percent from the revised reading for May, marking the first time it’s below Japan’s level since at least 1978, according to data compiled by Bloomberg.
A strengthening job market may escalate pressure on inflation, which central bank Governor Glenn Stevens said two days ago is likely to accelerate above his target range. Today’s report is also a boost to Prime Minister Julia Gillard, who plans to call an election in coming months and has already pulled her party ahead of the opposition in opinion polls.

And something as removed as anything you'll hear in the U.S. these days:
“If you are worried about inflation, these numbers are telling you there’s very limited spare capacity in the labor market, you are approaching full employment,” said Su-Lin Ong, senior economist at RBC Capital Markets Ltd. in Sydney.Source: ABS
Where are those jobs at?
Labor mobility (per the ever-knowing Wikipedia):
Labor mobility or worker mobility is the socioeconomic ease with which an individual or groups of individuals who are currently receiving remuneration in the form of wages can take advantage of various economic opportunities.Historically the US has had a very high mobility of our labor force. This has provided the United States with a mechanism to rebound and re-allocate resources following a downturn (i.e. moving from where the jobs were lost, to the next cycles jobs). As John Hempton described from an "outsiders" (he's Australian) point of view:
Worker mobility is best gauged by the lack of impediments to such mobility. Impediments to mobility are easily divided into two distinct classes with one being personal and the other being systemic. Personal impediments include physical location, and physical and mental ability. The systemic impediments include educational opportunities as well as various laws and political contrivances and even barriers and hurdles arising from historical happenstance.
Increasing and maintaining a high level of labor mobility allows a more efficient allocation of resources.
America has an amazingly mobile population – with almost all of the world’s busiest airports inside the US. Almost nobody seems to live in the town in which they are born. It is OK for Las Vegas to have a tourism based economy, Los Angeles to be based on entertainment and aerospace and Florida to be retirement because people in the US move when one part of the economy is struggling.More recently, there has been a lot of discussion about how the housing bubble and subsequent collapse will impact labor mobility (homeowners don't want to realize the loss, thus won't move to where the new jobs are). While this may be an issue, there haven't exactly been too many new jobs identified for the masses to go...
The BLS reports:
From December 2008 to December 2009, employment declined in 325 of the 334 largest U.S. counties according to preliminary data, the U.S. Bureau of Labor Statistics reported today. Trumbull, Ohio, posted the largest percentage decline, with a loss of 8.6 percent over the year, compared with a national job decrease of 4.1 percent. Almost 54 percent of the employment decline in Trumbull occurred in manufacturing, which lost 3,504 jobs over the year (-22.7 percent). Arlington, Va., experienced the largest over-the-year percentage increase in employment among the largest counties in the U.S., with a gain of 0.5 percent.Employment in the 335 Largest Counties - Orange is the U.S. Average

Source: BLS
Hedge Funds Remain Under Pressure
Another tough month for hedge funds...
Not a huge surprise given June's equity market performance (as detailed in the previous post What is an Investment in Hedge Funds?)
Source: Barclay Hedge
Tuesday, July 6, 2010
ISM Services: Slow Growth
ISM details what respondents are saying:
- "The general upswing in the economy, albeit minor, has had a positive effect." (Arts, Entertainment & Recreation)
- "Pricing pressures continue to increase as we see the economy begin to improve. Orders are still lagging in our industry." (Professional, Scientific & Technical Services)
- "Slow pace, but better than last year at this time." (Accommodation & Food Services)
- Funding issues and cash flow issues continue to affect public sector procurement. Almost all capital acquisitions have been suspended." (Public Administration)
- "We have seen a slight improvement in business activity over the past month." (Wholesale Trade)

Source: ISM
Equities for the LOOOOONNNNGGGG Run
Barron's highlights that 'stocks for the long-run' sometimes means a VERY long time (i.e. 30 years is not enough).
This hasn't been a short-term phenomenon. As Robert Kessler, head of the eponymously named Kessler Investment Advisors of Denver, points out, "perpetually maligned" 10-year Treasury zero-coupon STRIPS have outperformed both stocks (using the Standard & Poor's 500) and commodities (as measured by the GSCI total return index) over the past three, five, 10, 15 and 20 years.Chart of performance (these are total returns for each index) below:
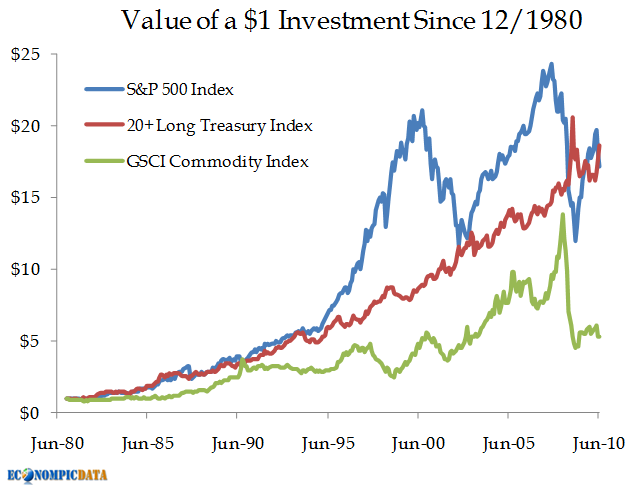
This 30 year window has included a remarkable bond bull market and the most recent 10 year zero return stock market. But Barron's points out that while things are likely to revert back to stocks outperforming over the next 5, 10, and 20 years, there are plenty of drivers (outside of a global economic slowdown) that may cause Treasury bonds to outperform.
Bull markets in bonds, Kessler continues, last as long as 37 years. Yields peaked some 28 years ago in 1982, so they can continue to decline. Even at this relatively advanced stage of the Treasury bull market, he also points out that U.S. households' allocations to Treasuries is just 1.7%, compared to 4.6% in 1994 and 8.1% in 1952. That doesn't take into account proxies such as ETFs such as TLT, but the underweighting of Treasuries makes suggestion of a bubble less than credible.Source: Barclays Capital, GS, S&P
Monday, July 5, 2010
The Employment Depression
Ambrose Evans-Pritchard makes the case that we shouldn't worry about going into a depression... we are already in one. Per the Telegraph:
Let us be honest. The US is still trapped in depression a full 18 months into zero interest rates, quantitative easing (QE), and fiscal stimulus that has pushed the budget deficit above 10pc of GDP.The below chart shows just how bad things are using the employment to population ratio. While women are at a 20 year low, men are just about at an all-time series (record keeping began in 1948) low.
The share of the US working-age population with jobs in June actually fell from 58.7pc to 58.5pc. This is the real stress indicator. The ratio was 63pc three years ago. Eight million jobs have been lost.
The average time needed to find a job has risen to a record 35.2 weeks. Nothing like this has been seen before in the post-war era. Jeff Weninger, of Harris Private Bank, said this compares with a peak of 21.2 weeks in the Volcker recession of the early 1980s.
"Legions of individuals have been left with stale skills, and little prospect of finding meaningful work, and benefits that are being exhausted. By our math the crop of people who are unemployed but not receiving a check amounts to 9.2m."

Back to Ambrose Evans-Pritchard's outlook, which is not all doom and gloom as long as central banks don't tighten on the monetary side while governments tighten on the fiscal front:
Perhaps naively, I still think central banks have the tools to head off disaster. The question is whether they will do so fast enough, or even whether they wish to resist the chorus of 1930s liquidation taking charge of the debate. Last week the Bank for International Settlements called for combined fiscal and monetary tightening, lending its great authority to the forces of debt-deflation and mass unemployment. If even the BIS has lost the plot, God help us.Source: BLS
Friday, July 2, 2010
EconomPics of the (Long) Week(end)
Economic Data
Employment Breakdown
Small Business Finally to Get Help?
ISM Manufacturing Growth Slows
Construction Disappoints
ADP Employment Shows Weakness
Consumer Confidence Crushed
The Chinese (Reporting) Bubble
Japanese Recovery Fading?
Texas Manufacturing Contracts in June
Asset Classes / Investing
Diversification Worked in Q2
The World is Ending... Time to Buy?
Gold as a Percent of Equities / Fixed Income
Income Distribution
After-Tax Income Distribution
Good to Be Government
The Impact of a Tax Hike
Happy 4th everyone:
Employment Breakdown
Bloomberg details:
Employment fell in June for the first time this year, reflecting a drop in federal census workers and a smaller-than-forecast gain in private hiring.Unemployment / Underemployment Rates
Payrolls declined by 125,000 last month as the government cut 225,000 temporary workers conducting the 2010 census, Labor Department figures in Washington showed today. Economists projected a decline of 130,000 payrolls, according to the median forecast in a Bloomberg News survey. Employment at companies rose 83,000. The jobless rate fell to 9.5 percent from 9.7 percent as the labor force shrank.

Change in Household Survey (note the HUGE drop in labor force participation)

Hours Worked per Person (this took some work with the limited data the BLS now releases)

Source: BLS
Thursday, July 1, 2010
Diversification Worked in Q2

The World is Ending... Time to Buy?
Dead Cats Bouncing details what the two year Treasury bond is indicating:
There are growing concerns that the U.S. risks a Japanese post-bubble scenario of endless economic stagnation, as reflected in tumbling implied inflation expectations in the TIPS market. The yield on 2-yr Treasury Notes yesterday dropped to its lowest level ever and as short-term Treasury yields typically track the nominal GDP growth (they effectively present a risk-free alternative to having 'geared' nominal GDP exposure via equities and corporate debt) current levels suggest that the market is expecting that an extended period of recessionary conditions and very low inflation. Treasury yields seem to be pricing in the double-dip recession that many economic bears have been calling.

Call me crazy, but ALL this negativity (justified in most cases) makes me think we are due for a short term pop in risk assets. As Meb Faber detailed on his World Beta blog a month back:
Just dipping in my toe only (not willing to risk much capital for a pure behavorial trade / bet). Wish me luck...On the monthly time frame, I examined asset class performance after a really bad month.
The take-aways from this study were:
- It does not pay to buy an asset class after a really bad month for the following 1 month.
- 12 Months later the return is not much different than average.
- 3 and 6 month returns, however, are stronger. You pick up on average about 3-4% abnormal returns buying after a terrible month.
A simple strategy would be:
After an asset class has a terrible month, wait a month then take a 2 month position. i.e. after this (probably) terrible month, buy July 1 for a two month hold. Those with a little longer time frame could move out to a 5 month hold.
Source: Federal Reserve
Subscribe to:
Posts (Atom)


