Showing posts with label deficit. Show all posts

Monday, March 12, 2012

What's Another Trillion?

Statesman details:

The U.S. federal deficit was slightly smaller through the first five months of this fiscal year than the previous year. Still, the deficit is on pace to exceed $1 trillion for the fourth straight year, which could be an issue in this year's presidential election.

The Treasury Department said Monday that the deficit grew by $232 billion in February. That increased the imbalance through the first five months of the current budget year to $581 billion, or 9 percent less than the same period in fiscal 2011.

The Obama administration expects the deficit will reach $1.3 trillion when the fiscal year ends Sept. 30. The government ran a record deficit of $1.41 trillion in 2009 and a $1.29 trillion deficit in 2010.
While the scale of deficits has been alarming, it should come as no surprise given the huge incentives for politicians to push revenues lower and spending higher, as well as the strong dependence for improvement (of both the revenue and spending side) on a weak underlying economy.

Politicians like to be elected. On the spending side of the equation, the easiest way (it seems) to be elected in the U.S. is to spend during prosperous times, as voters (not surprisingly) like to feel prosperous during these prosperous times (hence the limited number of times the below chart turns negative). One issue is that spending moves even higher during downturns due to all the social safety nets that kick in, pushing the deficit higher and higher each business cycle.


Similarly, tax revenues depend on these same politicians that want to be elected (during good times, why not cut taxes?) and shows a similarly strong relationship with the same underlying economy. In fact, revenues are similar to the S&P 500 in that they grow at roughly the same rate as nominal GDP over the long run, yet exhibit larger swings at turning points.
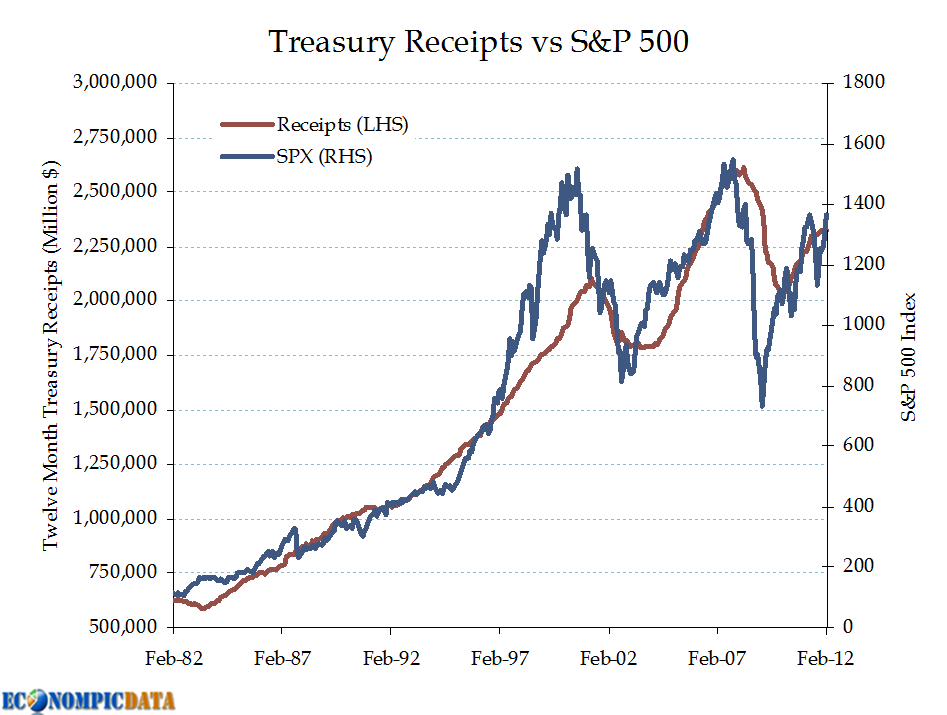

So... for the average voter of this great land, taxes are always too high and spending too low (hence deficits tend to remain even during prosperous times) and when downturns hit, the US finds itself long equity beta on the revenue side and short put options (social safety nets) / inflation (cost of spending) on the spending side.

Is it any wonder we're in this
situation?

Source: Treasury

Tuesday, July 13, 2010

Budget Deficit: Going for Broke

The Good = An Improvement

BusinessWeek details:

The U.S. government posted a smaller budget deficit in June compared with the same month last year as the economic recovery brought in more tax revenue.

The excess of spending over receipts fell to $68.4 billion last month from $94.3 billion in June 2009, according to a Treasury Department report issued today in Washington. It was the 21st consecutive shortfall. For the fiscal year to date, the budget deficit totaled $1 trillion compared with $1.42 trillion during the prior year to date.
The Bad = The Levels

Treasury receipts in the first 9 months of fiscal year 2010 equaled $1.6 trillion. Just about the same level as in 2001, when spending was 54% of current levels.


Source: Treasury

Thursday, November 12, 2009

Spending Down + Deficit Up = Not Good

Bloomberg reports:

The U.S. budget deficit widened in October from a year earlier, reaching a record for that month, as rising unemployment cut revenue at the start of the first full fiscal year under President Barack Obama.

The excess of spending over revenue widened to $176.4 billion last month, compared with a deficit of $155.5 billion in the same month a year earlier, the Treasury Department announced today in Washington in its monthly budget statement. It was a record 13th consecutive shortfall and the fifth-largest monthly gap on record, the department said.


The issue may be that outlays are reduced (non-stimulating) and the deficit still grows due to the collapse in revenues. That my friends, would be a lose-lose for the economy.

Source: Treasury

Friday, September 11, 2009

Budget Deficit Improving

Forex Yard with the latest:

The U.S. government posted a $111.40 billion budget deficit in August, slightly smaller than a year ago due largely to calendar shifts and matching a record period of 11 straight monthly deficits, the Treasury Department said on Friday.

The August budget gap was well below the forecasts of analysts polled by Reuters, who predicted a $152.0 billion deficit for the month. The year-ago deficit was $111.91 billion.

A surprise to the upside (though still very negative), but an improvement none-the-less. We can see this below with a chart that details the year over year change, smoothed out over three month time frames.


My concern is that the massive spike in outlays was the sole reason for economic prints coming in more "stable" over the past few months (although it is amazing that this level of spending didn't create many absolute positives in recent months).

The question is what happens when the government doesn't have it's next cash for _____ program?

Source: Treasury

Wednesday, August 26, 2009

Another Jobless Recovery, Even with a Deficit Spike

The Office of Management and Budget just came out with their revised Mid-Session Review budget of the U.S. Paul Krugman commented:

What everyone should be focused on is the sheer awfulness of the economic projections. OMB has unemployment still at 9.7% at the end of 2010; still at 8% at the end of 2011. These numbers cry out for a more aggressive economic policy. If that’s politically impossible, we’re really in terrible shape.
True, the projections are for a "recovery" with a 9.7% unemployment rate in 2010 and 8.6% in 2011 (not sure how much of a recovery it will feel like).


But, how much more aggressive should the government be? While Krugman may be right that it isn't enough, it is a solid $2 Trillion more than was previously budgeted. Politico details:
The White House Office of Management and Budget’s Mid-Session Review, an annual update between budgets, put the 10-year deficit estimate at $9.051 trillion, up from the previously projected $7 trillion. The administration had leaked the figure over the weekend.


How large is $9 trillion? Well, it is about $3 trillion more than the cumulative deficit from 1980-2009 (ignores inflation, but a sizable chunk of change none-the-less).


Source: Whitehouse.gov

Friday, April 10, 2009

Budget Deficit Close to $1 Trillion in First Six Months

Marketwatch reports:

The U.S. federal budget deficit rose to a record $956.8 billion in the first six months of the fiscal year after the government stepped up spending to cope with a recession that has depressed tax receipts, the Treasury Department reported Friday.
The deficit is well on its way to the $1.75 trillion -- or 12.3% of gross domestic product -- that the White House has estimated for the full fiscal year, which ends in September.

The deficit through the first six months is more than three times higher than it was at this time last year. The government has borrowed $1 trillion from the public so far this fiscal year.


Source: Treasury

Friday, February 20, 2009

How Much is a $2.5 Trillion Deficit?

James Quinn at Financial Sense.

The annual deficit for 2009 is now estimated at between $2 trillion and $3 trillion give or take a few hundred billion. These figures seem incomprehensible to the average person on the street. Some perspective is in order. If we use $2.5 trillion as the estimated deficit that means:

*We’re adding $6.85 billion per day to the National Debt
*We’re adding $285 million per hour to the National Debt
*We’re adding $475,000 per minute to the National Debt


Have a great $14 Billion weekend everyone!

Source: Financial Sense via Infectious Greed

Monday, February 16, 2009

Federal Obligations > Annual Global Economy

Worldnetdaily reports:

The real 2008 federal budget deficit was $5.1 trillion, not the $455 billion previously reported by the Congressional Budget Office, according to the "2008 Financial Report of the United States Government" as released by the U.S. Department of Treasury.

The difference between the $455 billion "official" budget deficit numbers and the $5.1 trillion budget deficit cited by "2008 Financial Report of the United States Government" is that the official budget deficit is calculated on a cash basis, where all tax receipts, including Social Security tax receipts, are used to pay government liabilities as they occur.
I believe I correctly backed into that $5.1 Trillion number below (drop me a comment if anyone interpreted this differently).

Click for larger chart


More frightening, the article details the growing federal obligations as calculated by John Williams at Shadowstats:
Calculations from the "2008 Financial Report of the United States Government" also show that the GAAP negative net worth of the federal government has increased to $59.3 trillion while the total federal obligations under GAAP accounting now total $65.5 trillion.


How large a figure is this? More than the size of the global economy, estimated at $54 Trillion for 2007.

Source: ShadowStats / Department of Treasury

Thursday, January 15, 2009

Deficit as a Percent of GDP

On Tuesday, I posted a chart showing the growing budget deficit and received this request:

Better yet, show outlays and receipts as % of GDP and take it back to 1945.
Unfortunately, I only was able to dig out budget data going back to the early 1980's, but it does have an interesting story to tell. Over the past 12 months, the deficit has grown to ~6% of nominal GDP (for December 2008 I assumed nominal GDP decreased -1% QoQ).


At first glance I was relieved that we were only in a situation as bad as that of the early 1990's, but then I forgot this deficit doesn't yet include any of the new stimulus plan.

Even scarier (at least to me) is looking at the budget surplus / deficit as a percent of receipts, the pre-stimulus deficit is now a whopping 33% of total receipts.

Tuesday, January 13, 2009

Receipts Down, Outlays Up = Soaring Deficit

CNN Money reports:

The federal budget deficit expanded by $83.6 billion in December, the Treasury Department reported Tuesday, bringing the total deficit for the first three months of the 2009 fiscal year to $485.2 billion. By comparison, the budget deficit for all of fiscal year 2008 was $455 billion. In fiscal 2007, it was $161 billion.


Over the last 12 months, the deficit is an astounding $816 Billion, which will seem small all too soon.

Source: Treasury

Wednesday, January 7, 2009

Budget Deficit... Overly Optimistic and Still Ugly

The CBO released their latest budget projections and although expected, it ain't pretty. Off-budget surplus relates to surpluses in the Social Security trust funds as well as the net cash flow of the Postal Service, while the projected on-budget deficit is an unreal $1.34 Trillion (or $1.19 Billion net the off-balance sheet item). But that's not all. According to Interest Rate Roundup:

Here's the really fun part: The CBO estimate doesn’t even include any potential stimulus package from Congress and the Obama administration. We haven’t gotten the final details of the plan, but it could cost anywhere from $675 billion to $1 trillion. That means the ultimate 2009 deficit could end up being larger by 60% ... 70% ... 80% ... or more.


And the reported figure is based on what seems to be highly optimistic economic growth. Real GDP is projected to be a little below -2% in 2009, then snap back to 1.8% by 2010. I don't buy these numbers and Paul Krugman details why this projection is overly optimistic based on the estimated GDP Gap and stimulus plan stated (bold is me).
The new CBO budget and economic outlook is out. Above (go to the post) is its forecast for the GDP gap — the hole stimulus has to fill. I’d guess that the CBO estimate, which has unemployment averaging 8.3 percent in 2009 and 9 percent in 2010, is actually too optimistic, but even so it puts the Obama plan in perspective: a 3% of GDP plan, with a significant share going to ineffective tax cuts, to fill an 8% or more gap.


Real GDP is projected at 4% each year from 2011-2014 and 2.5% each year from 2015-2018. This in a world in which the U.S. economy will no longer be levered up. Please note that all of these 2011+ projections are higher than what was projected back in September in growth terms, but they are based on a lower beginning value (and total GDP is down in each year than was projected in September).

Even with these optimistic numbers, the U.S. projects $400 billion a year in deficits for the next 10 years. We have to pay for this somehow (i.e. borrow), which goes completely against my case in a previous post that Treasuries may not be in a HUGE bubble (though I do think they are over the longer term).

Monday, October 13, 2008

U.S. Budget Deficit... $2 Trillion!?!?!

Per Bloomberg:


Bailouts of American International Group, Fannie Mae and Freddie Mac likely will be more expensive than expected. States are turning to Washington for fiscal help. The Federal Reserve said this week it will begin buying commercial paper, the short- term loans companies used to conduct day-to-day business, further increasing costs. And analysts now say the $700 billion bank- rescue plan passed by Congress last week may have to be significantly larger.
and

The 2009 budget deficit could be close to $2 trillion, or 12.5 percent of gross domestic product, more than twice the record of 6 percent set in 1983, according to David Greenlaw, Morgan Stanley's chief economist. Two weeks ago, budget analysts said the measures might push deficit to as much as $1.5 trillion.
Well, I calculate the number closer to 14% ($2 Trillion / GDP in Q2 of 14.3 Trillion). Either way, an expected deficit more than 2x the previous record set more more than 25 years ago.

Wednesday, August 13, 2008

U.S. Budget Deficit Indicates Recession

The Age reports:

The United States federal budget deficit soared in July, pushed higher by stimulus payments and outlays to protect depositors at failed banks. The Treasury Department reported that the deficit for July totaled $US102.8 billion, nearly triple the $US36.4 billion deficit recorded in July 2007.

Lets take a deeper look...

The first chart below shows historical receipts, outlays and the deficit over twelve month rolling periods, while the second shows the year over year change in receipts and outlays over these periods, along with the difference between the two YoY changes.

Interestingly, this difference has turned negative in all of the four recessions (yes I'm calling this a recession!) since this data has been released...