Tuesday, March 31, 2015

The Disappearing Value Premium?

Eugene Fama and Kenneth French released their seminal white paper 'The Cross-Section of Expected Stock Returns' in June 1992 which added value (as well as size) as explanatory factors that drove market (out)performance. 

Fama and French attempted to better measure market returns and, through research, found that value stocks outperform growth stocks.
Why does the value premium exist? There are broadly two explanations... an efficient market explanation and inefficient market explanation. Back to Investopedia:
On the efficiency side of the debate, the outperformance is generally explained by the excess risk that value and small cap stocks face as a result of their higher cost of capital and greater business risk. On the inefficiency side, the outperformance is explained by market participants mispricing the value of these companies, which provides the excess return in the long run as the value adjusts.
While I don't believe markets are completely efficient (too much proof outlining the opposite), I do believe markets are generally pretty darn good at eliminating blatant inefficiencies once discovered. 


What happens when inefficiencies are identified? 

Investor flows come in eliminating the inefficiency and the plain vanilla version of the value factor (price to book) appears to be no exception. Between 1995 and the end of 2014, the amount of money allocated to passive large value funds / ETFs grew more than 30% compounded / year, growing from slightly over $1 billion to more than $180 billion (and this doesn't include the MASSIVE amount of institutional separate accounts that went this direction), while small value went from literally $0 indexed to $18 billion in funds and ETFs. Including active managers, large / small value fund / ETF AUM grew from $86 billion to more than $1.1 trillion over that time frame.


The declining value premium

Below is a long term chart of the difference between the cheapest and richest stocks by book-to-market (the Fama French size factor) over rolling twenty year periods (20 years as this closely matches the time frame since the 3-factor white paper was published). While not necessarily completely dead, there is a material decline.


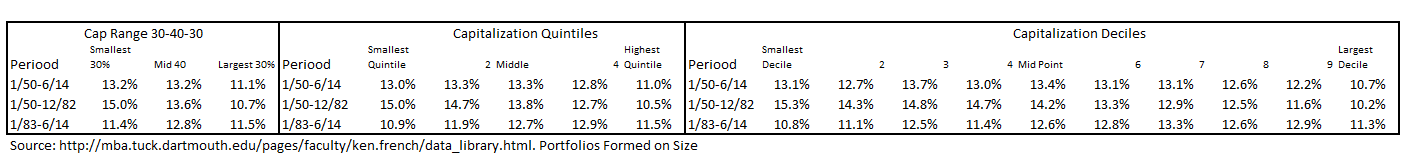
And how has this translated to index performance? Well, over shorter time frames, the results are even more striking (investor performance is similar in that the average "dumb" growth investor has outperformed the average value investor over these periods, despite a larger behavioral gap in growth than in value).

As of February 28, 2015


Even the best value investor of our time has seen massive compression in his ability to outperform (pulled from the always great blog A Wealth of Common Sense).


Is the value premium dead? 

Despite all of the above, in my view... absolutely not. What I feel is dead is an investor's ability to capture the value premium by simply allocating to companies with lower price multiples, ignoring all other fundamental aspects (growth, competitive landscape, etc...). In other words, like anything else in investing that becomes well known, the ability to outperform requires skill as the low hanging fruit of value may be dead.


Additional note: I find it utterly fascinating that those investors who believe active management is dead, pointing to the underperformance of passive over the last 5+ years as proof, are in many cases the same investors that believe value works, but it just needs "more time" or a different screen than book to price (the latter being an "active" decision). 

Friday, March 27, 2015

Your Bond Allocation Doesn't Matter as Much as You Think

Quick... which of the three allocations A, B, or C is 60% S&P 500 Index / 40% Barclays U.S. Aggregate Bond Index,  55% S&P 500 Index / 45% Barclays U.S. Corporate Bond Index, or 62% S&P 500 Index / 38% Barclays Treasury Bond Index going back all the way to the inception of the Barclays U.S. Aggregate Bond Index in 1976?


Tough right? How about a chart of a growth in $1 invested in each of the allocations


Still nothing? That's because you can access credit risk two main ways... through stocks or through spread, while rate exposure at the end of the day all comes back to rates on Treasury bonds. An allocation with a higher equity tilt, balanced with bonds with no credit risk (i.e. a pure Treasury allocation) provides the same exposure (and returns) over time as one with a lower tilt towards stocks with additional credit coming from spread.


So what?

While I do think there are times when there are more attractive means of gaining credit exposure through stocks, investment grade bonds, high yield bonds (a simple model I presented back in 2010 highlights how this might add value), you need to make a material reallocation to move the needle. On the other hand, a buy and hold investor can and should allocate to credit and rates in what is the most: (1) structurally efficient (i.e. minimal transaction costs), (2) cost effective (i.e. cheapest), (3) tax-efficient. 
  1. Structurally efficient: stocks and treasury bonds both trade at much tighter bid/ask spreads than corporate bonds. More important, during periods of stress, treasuries are MUCH more liquid - winner: stocks and treasuries
  2. Cost effective: interestingly enough, the cheapest treasury bonds ETFs are slightly higher in cost than the cheapest Aggregate Bond ETFs, but both are slightly higher than ETFs for the S&P 500; either way, we're talking bps here - a wash
  3. Tax-Efficient: the more you are allocated to stocks, the more tax efficient you become as capital gains are taxed at a much lower rate than bond coupons - winner: stocks and treasuries
Takeaway... while stocks balanced with treasuries may have a slight edge in terms of implementation, at the end of the day, it really doesn't matter. If you are spending too much of your investment time trying to decide whether to slightly change your bond allocation away from treasuries to another duration sensitive area of the bond market given fears of a rate hike, please spend your time elsewhere.


Footnote: I initially listed what allocations A, B, and C were... then I remembered it doesn't matter.

Wednesday, March 25, 2015

Fearful of Rising Rates? Stocks Have You Covered

Josh Brown (i.e. The Reformed Broker) has a nice piece questioning the merit of unconstrained bond funds. Embedded within that article was this gem:

In fact, since 1976, U.S. stocks and bonds have not declined at the same time for more than two consecutive months. Over the last 60 years, there’s only been one year in which both stocks and bonds posted an annual decline (1969).
You can actually make a bolder statement than that given that the Barclays US Aggregate Index' inception wasn't until 1976. The S&P 500 and "Agg" have never declined at the same time for more than two consecutive months. As surprising to me was that stocks and bonds on a stand-alone basis have only declined more than two straight months about 5% of the time (i.e. once every year and eights months).


So if rates rise from here (negatively impacting bonds), how will stocks perform? I'm glad you asked.

Jeremy Schwartz (@JeremyDSchwartz) outlined a few months back during a back and forth that stocks (especially small cap stocks) have historically performed very well during periods of rising rates... going back all the way to the 1950's.

Taking that one step further, the below breaks out performance by small, mid, large across value and growth during periods of rising rates since 1994 (I can only get daily Russell data going back 20 years). In this case, rising rates is defined as periods where the 10 year Treasury rose more than 100 bps without a 50 bp decline (there have been 9 such periods since 1994). Not only have stocks broadly performed exceptionally well in these periods (with small caps outperforming), growth stocks have performed even better (the less "bond-like" the stocks, the better the performance in rising rate environments).


For those fearful of a sell-off in rates... what to do? Well, if history holds, simply hold a balanced portfolio consisting of stocks and bonds. Want to be bolder? Tilt slightly towards small and/or growth. As for unconstrained bonds... let investment managers fleece you somewhere else.


Source: Russell, S&P, Barclays

Monday, March 23, 2015

The Benefit of Slowing Down the Rebalancing Process

One of the top Google “rebalance free lunch” results is an article quoting one of the brightest minds in finance, Clifford Asness, that I think most investors would agree with:

"Rebalancing is one of the few free lunches out there," said Clifford Asness, managing principal of New York hedge fund AQR Capital, in a recent interview with the Online Journal. "You're generally selling things that have gone up the most and buying things that have gone down the most."

While the article is from 2004 (and he may have changed his tune), I like that he felt rebalancing was a free lunch despite the strong research he has done over the years specific to momentum, something he acknowledges the rebalancing process eliminates in the same article:
 "Someone who doesn't rebalance is a tacit momentum investor." 

The key points in my mind as to why rebalancing may not be a free lunch:
  1. Momentum works: much research exists outlining that momentum can improve risk-adjusted performance (here is a great white paper by Cliff Asness himself)
  2. Relative outperformance doesn’t equal a relatively more expensive asset: quite simply, stocks SHOULD outperform over time as they can grow their earnings, while bonds pay a static coupon. So rebalancing doesn't always mean selling high and buying low.

It would be good enough if slowing down the rebalancing process did not materially hurt performance, as there are significant benefits associated with slowing down (lower transaction costs, tax benefits through delayed capital gains, and any behavioral benefit of looking at your account less often), but rebalancing less has actually improved average results specific to a 60% S&P 500 / 40% Barclays Aggregate Bond index since the latter’s 1976 inception with seemingly more potential outperformance than underperformance over any 36-month iteration.


Source: S&P, Barclays