
In recent weeks, a number of investors I respect have commented that Treasuries are rich and should be avoided (or even outright shorted). Recent examples include Doug Kass and James Montier, both of whom claim current yields put too much weight on expectations of a double dip. I simply don't agree...
While I am not a Treasury bull, it is my view that at a 2.7% yield Treasury bonds are fairly valued when one takes into account the low growth / low inflation outlook, the Fed's extended easing policy, and the potential for capital appreciation rolling down the steep yield curve. Below we'll take a look at these three points in more detail.
Point #1) Nominal Growth Matters
This point was first shown in the following chart a few weeks ago.
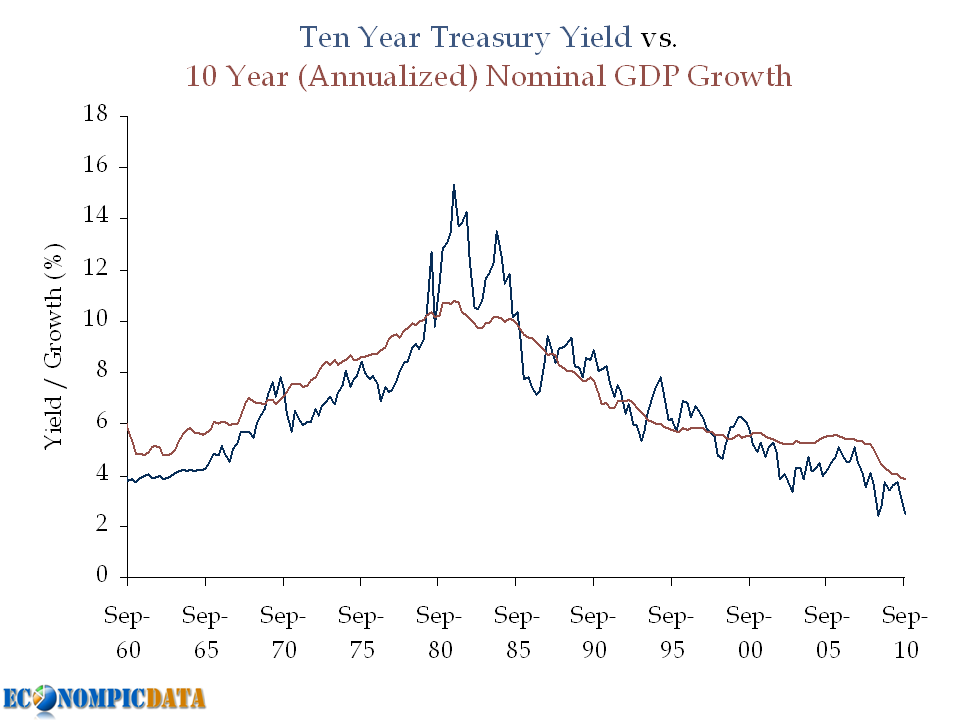
In Doug's post he compares historical real GDP to Treasury yields and notes that bonds should be yielding more (he notes that Treasuries have historically yielded ~360 bps more than real GDP). The problem with this analysis outside of an apples (real GDP) to oranges (nominal Treasury yield) approach, is that a large portion of this "spread" was due to the inflation spike seen in the chart above during the late 1970's / early 1980's; a period marked by high nominal Treasury yields and low real GDP.
Point #2) The Importance of Monetary Easing Policy
A bond investor that does not take duration risk can only earn VERY low rates over the next few years as long as the Fed is on hold. If an investor earns VERY low rates for each of the next two years, they will need to earn a much higher return for the remaining 8 years just to break-even with the Treasury investment. The key is that the market is pricing this in.
Example:
Assuming a "zero" interest policy for two years (by zero, lets assume 0.25%), this means that a 2.7% yield can be achieved as follows:
- The first 2 years at 0.25%
- The last 8 years at 3.32%
The chart:

The relevance? The market is not forecasting rates will stay as low as they are now (i.e. forward rates are higher... closer to that 3.32% rate than 2.71%), which means capital losses will not happen simply if rates rise from current levels, but rather rise above levels expected by the market going forward.
Point #3) Don't Forget the Rolldown
The yield curve is VERY steep (i.e. upward sloping). This means that the 10 year bond will not only return its yield over the next 12 months if nothing changes (i.e. if the yield curve is exactly where it is today in 12 months), it will return more.
How much more?
Using current figures, the 10 year Treasury is yielding 2.71% while the 9 year Treasury is yielding 2.54% (17 bps difference). Assuming that nothing changes, performance of a 10 year bond over the next 12 months will be made up of the 2.71% yield plus the capital appreciation from moving from a required yield of 2.71% to 2.54% (i.e. a bond with a 2.71% coupon and a required yield of 2.54% will be worth more than par). This specific 17 bp move would add an additional 1.5% (assuming a duration of 8.75 years on a ten year Treasury) over the next 12 months, which means a 4.2% return for the 10 year note if nothing changes.

Source: Federal Reserve / BEA


