
EconomPic has outlined the seasonal performance of the equity market (with a "secret sauce" twist) a number of times (most recently here).
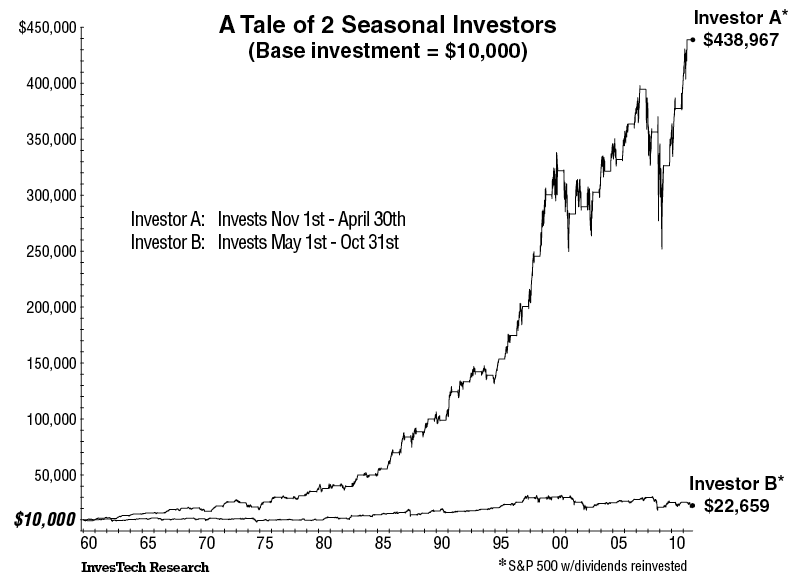
Here are the specifics of seasonality: Imagine we start with two $10,000 accounts, and use them to make investments in an S&P 500 Index fund. One account invests in one 6-month period, the other invests in the remaining 6-month period. Account A is invested from November 1st through April 30th each year, while Account B is invested from May 1st through October 31st.
Here are the numbers:
• Account A portfolio grew from $10,000 to over $438,967. That is a 42-fold increase.
• Account B portfolio barely doubled to $22,659.
A chart outlining the above phenomenon going back to 1959 can be found here, but I thought I'd take some alternative looks.... one that goes back further in time (all the way to 1871) to see when this seasonality started and one taking a look at the real return (i.e. after inflation) of each leg since 1959.
140 Year Rewind
Using S&P data from Professor Shiller's Irrational Exuberance site, I constructed the below chart going all the way back to 1871. The outperformance of the November - April time frame since 1959 can be seen, but interestingly enough before that date both periods had almost the exact same performance. Begging the question... what changed around 1959?

Real Seasonality (1959 - 2011)
You thought the original May - October figure looked bad in nominal terms? After inflation, total returns for that six month period over 52 years (312 months) were negative, while the November - April time frame posted annualized real returns ~10%.

Source: Irrational Exuberance

Amazing. Thanks Jake.
ReplyDeleteSuggest the analysis is redone by shifting the positions of the 6 month periods to see if the results can be improved and then from there break the year up into 3 periods and do the same. This might narrow down the specific features causing the result even more.
ReplyDeleteAnother look at this is at Does the S&P 500 exhibit seasonality throught the year? My conclusion was that the phenomenon probably is real, but it seems to be fading.
ReplyDelete