Wednesday, December 31, 2008

Happy 2009

As 2008 comes to an end, it is easy to curse the year that was. I urge you all to remember that the greatest things in life are not your personal finances. For me this includes:

  • My family remained healthy and happy
  • The birth of my first nephew
  • Living in the greatest city on earth (in my opinion), New York City
  • The ability to reach out to thousands (shocking) of readers via EconomPic Data
  • And most important to me... getting engaged to an unbelievably caring (and gorgeous) woman

Rather then just put this year in the past, I urge you all to look forward to a brighter 2009.

Best wishes to all and a happy New Year.

-Jake

"Scariest Housing-Related Chart Ever"

Mr. Mortgage, with data from DataQuick, posts the "Scariest Housing-Related Chart Ever" (though he only shows the data... below is the chart):


Down almost 50% from peak levels in less than 2 years! In the comments section, BertDilbert lays out what it all means to California very well:

This decline of housing values in CA is absolutely going to destroy seniors who had counted their house value in their net worth, and planned on that being there for retirement. Add to that what has happened to the value of CA bonds that they were booking income off of. If they were planing on selling those and CA is on the rocks they might be in for a surprise there. Now add in every other asset they held is likely down as well and lots of blue chip dividends they had relied on might be chopped entirely.

Plus add in that CA is going to raise taxes. Where does this leave CA seniors? Those that had planned to retire in CA may no longer be able to retire here. This is going to send them state shopping for sure for a low tax retirement state that they can afford.
Update:
Max Rockbin comments:

FIRST: What if the graph showed the few years before this price drop? You would see those same housing prices skyrocketing. Seniors (who presumably mostly owned their homes before that run-up) are still way ahead. They just don't get the windfall from the bubble.

Also, why does the scale start at $250K? That just makes the chart look steeper than it really is. The numbers are grand enough not to require that kind of trite distortion.
1) If the chart showed the data a few years prior, I agree that it would show those housing prices skyrocketing. However, seniors (who did own their homes before that run up) are not necessarily "way ahead". Over the past 3-5 years, an awful lot of this wealth was already monetized and spent through home equity loans, while many used their $100,000 house that appreciated to $200,000 to pay the down payment for their new $500,000 house now worth $250,000.

In addition, I am positive that some seniors retired on the notion that their home had a specific value (while the others included this inflated price to calculate their wealth). I personally know of multiple individuals who have postponed their retirements these past 6-8 months as their wealth has declined at an alarming rate. Those that retired in 2005-06 with the notion that their home was worth 50% more are crushed.

2) Below is the same data with a scale starting at zero. I'll agree that I should have done it this way in the first place, but it sure as hell doesn't make the information look any rosier.

Euro Approaching Parity with Pound Sterling

Guardian (hat tip Credit Writedowns):

The world’s foreign exchanges were today readying themselves for parity between sterling and the euro after further selling sent the pound to within touching distance of a one-for-one exchange rate against the European currency.

The euro has risen by almost a third against the pound in the course of 2008, with an 18% appreciation in December alone. Sterling’s trade-weighted index against a basket of currencies fell to 74.2% of its 2005 value, its lowest since the Bank of England first kept daily records in 1990.

Equity Forecasts: Bullish and Highly Uncertain

2009 forecasts per WSJ's MarketBeat:


Twelve out of sixteen forecasters are calling for positive returns for the S&P 500 in 2009. My thoughts? No clue. There are a ton of reasons why equities should suffer... BUT, there is a ton of money waiting on the sidelines ready to chase returns when markets turn.

I think Robert Pavlik of Oak Tree Asset Management sums it up best regarding his prediction:

“you’ll be better off asking me on 12/31/09 at 3:59 pm.”

Tuesday, December 30, 2008

In Excel this is called a Circular Reference Error

Per the MBS Purchase Program FAQ (hat tip Across the Curve):

Assets purchased under this program are fully guaranteed as to principal and interest by Fannie Mae, Freddie Mac, and Ginnie Mae, so the Federal Reserve's exposure to the credit risk of the underlying mortgages is minimal.
Click for ginormous picture

Armageddon Index Crushed, but an Improved Outlook

Consumer Confidence hit another low in December:

The Conference Board Consumer Confidence Index™, which had increased moderately in November, declined to a new all-time low in December. The Index now stands at 38.0 (1985=100), down from 44.7 in November.
Below is as a chart of EconomPic's 'Armageddon Index' (details here) for December. As can be seen, consumer confidence was crushed in December for current business conditions and labor markets, but those surveyed are more optimistic (on a relative basis) in their outlook than in October.


Case-Shiller Price Index (October)

For more information on what the Case Shiller Price Index is and why it may be an important measure, check out this old post.

The Case-Shiller Price Index (an adjustment to CPI) turned severly negative year over year, down 1.4% from last October as home prices, a global slowdown, and the reversal in energy prices severely impacted price levels.


Looking at the five year change in the Case-Shiller Index (the housing index, not the self created price index), we see home prices reverting back to a more "normal" 2% annualized level. However, after the bubble, which peaked in 2005-06, expect a severe over-correction to the downside.


Source: BLS / S&P

The Emerging... 'Emerging Market' Crowd Out

The Financial Times via Naked Capitalism details the issues Emerging Market countries may face

Record volumes of government bonds from the industrialised nations – intended to reverse what could be the worst recession since the Great Depression – threaten to curb access to credit markets by emerging economies.

Analysts warn that emerging market borrowers could be crowded out of the credit markets by $3,000bn of government bonds expected to be issued by the big developed economies in 2009 – three times more than in 2008. The US alone is expected to issue about $2,000bn next year....
How dependent are Emerging Market countries to credit markets? Well, as can be seen below BRIC countries alone have~$3.5 trillion in External Debt Payments to make in 2009.

Monday, December 29, 2008

Information Warfare and the Wall Street Journal's Demise

Flying around the Internet and blogosphere is the Wall Street Journal's* ridiculous feature of Dr. Igor Panarin's prediction for the United States (interestingly enough, Bloomberg posted the same story to less fanfare a month ago):

Mass immigration, economic decline, and moral degradation will trigger a civil war next fall and the collapse of the dollar. Around the end of June 2010, or early July, he says, the U.S. will break into six pieces -- with Alaska reverting to Russian control.
So why can't I take Dr. Panarin seriously, besides the fact that he also mentions Texas will be taken over by Mexico? The #1 Google result when searching 'Igor Panarin' turns up this russiahouse.org bio (bold mine):
Prof. PANARIN is the author of nine books, "Infowar and power”, “Infowar and world”, “Infowar and election”, and others, and of many political essays published in various journals.
And...
His main interests are history, philosophy, psychology, computer science, communication, election technology, conceptual problems of globalization, the theory and practice of infowar.
A quick search for 'information warfare' (i.e. infowar) on Wikipedia reveals infowar includes:
Collection of tactical information, assurance(s) that one's own information is valid, spreading of propaganda or disinformation to demoralize the enemy and the public, undermining the quality of opposing force information and denial of information-collection opportunities to opposing forces.
Not that the United States isn't an expert at infowar (and at times has focused that expertise directly on Russia), but it isn't typically this obvious.

Two initial questions; why is the Wall Street Journal focusing on an individual with an obvious agenda (i.e. selling books / gaining global attention)? Why is the author, Andrew Osborne (also known for his insightful piece on Putin branded Vodka), doing his best to make Dr. Infowar seem credible?
Prof. Panarin, 50 years old, is not a fringe figure. A former KGB analyst, he is dean of the Russian Foreign Ministry's academy for future diplomats. He is invited to Kremlin receptions, lectures students, publishes books, and appears in the media as an expert on U.S.-Russia relations.
And why did Mr. Osborne only once mention information warfare, but in that case make it nothing to do with one of his books or "hobby"?
In September 1998, he attended a conference in Linz, Austria, devoted to information warfare, the use of data to get an edge over a rival. It was there, in front of 400 fellow delegates, that he first presented his theory about the collapse of the U.S. in 2010.
Let me see if I can't wrap this whole thing up and come up with a conclusion...
  • Dr. Panarin is an individual from a country (Russia) that is becoming more and more hostile towards the United States
  • That same individual lists that his MAIN interests include THEORIZING AND PRACTICING INFORMATION WARFARE and is the author of nine books, of which at least three are written on the topic of INFORMATION WARFARE
  • Yet he is listed as being a credible professor with inside ties to the Kremlin by the Wall Street Journal
The only conclusion is Rupert Murdoch has done it yet again and will only stop when he completely ruins the credibility of the Journal (though I am optimistic he can't top what he and his son have done with the NY Post... not that there's anything wrong with it). It is truly frightening when a financial newspaper still thought by many as credible, is more focused on entertaining than informing.

California: Too Big to Fail?

The Bond Tangent points to a Bloomberg piece declaring California Muni Bonds are priced for trouble:

“The spreads have widened and investors are getting much more compensation for California bonds,” said Paul Brennan, who oversees about $12 billion in municipal-bond funds for Nuveen Asset Management in Chicago. “There’s still a lot of ups and downs to come unless there’s some dramatic budget agreement that could change all that.”
As we can see below, yields on 10 Year California General Obligation "GO" Bonds have indeed increased, in a period in which the 10 year note has rallied ~200 bps.


In addition, California bonds have widened by a similar "relative factor" as compared to the entire GO Muni Bond Index.


In other words, the bonds are pricing in a chance of default (it now costs $400k to protect $10mm worth). Back to the article:
The nation’s most-populous state will run out of money to pay bills as soon as February unless lawmakers end an impasse over how to close the funding gap. California has the second- lowest credit ratings in the country because of perennial fiscal shortfalls and legislative gridlock.
Going back to The Bond Tangent... while some states and municipalities will have issues funding their budgets, California will make due. Why? For one... the negative stigma associated with a failure to make the payments.

More importantly though, it all goes back to the question of "too big to fail".
It is not difficult for me to see more smaller government entities going bankrupt. But one of the world's largest economies? People really need to get a handle on what this would mean.
I can't agree more...

Real GDP Per Capita

Per capita real GDP was slightly negative 'year over year' through the 3rd quarter.

Many forecasts project this recession to be the worst since the Great Depression. If true, expect this figure to drop significantly below the -4% level seen in the recessions of the 1970's or early 1980's.


Note that the ten year rolling annual average real GDP growth per capita has slipped to 1.3% as of September 2008, which is the lowest print since 1984.

Source: BLS / BEA

Japanese Industrial Output Down to Levels Seen 5 Years Ago

As we reported last month, Japan's industrial output has been hurt significantly by the global slowdown. In November, it only got worse. Marketwatch reports:

Industrial production fell as much as 8.1% in November from the previous month -- the biggest drop in the measure since the government started releasing comparable figures in 1953 -- as Japanese companies produced less automobiles and other machinery on vanishing demand.


Overall industrial output at a levels from 5+ years ago in a matter of months... yikes.

Source: METI

Friday, December 26, 2008

EconomPics of the Week (12/26/08)

Economic Data
Real vs. Nominal GDP / Expectations for Q4 GDP
Personal Consumption; Necessities Reign Supreme
We're All Socialist Now...

Credit Markets
A Continued Good Sign in Credit Markets
30 Year Swaps Flat to Treasuries

Real Estate
Housing Bubble Defined
When Housing Became a "Serious Liability"
Hotel Struggles

Opinion
Asset Price Declines, Wealth Destruction, and Federal Bailouts
Another Reason to Hate the Yankees
Is the Bailout Hurting Pension Plans?

Other
Bank Valuations --> Then and Now
Corporate Profits Struggling
2008 Was Not the Year for M&A
Wealth Concentration by State

Real vs. Nominal GDP / Expectations for Q4 GDP

Below is a breakdown of the recent "Final Q3 08 GDP" release:


Nominal GDP growth in the recent quarter was relatively flat to the Q2 figure and at or above the nominal GDP growth levels from Q4 '07 and Q1 '08. Real GDP growth, however, was significantly lower than Q1 or Q2 due to an increase in the GDP Deflator. (If you're new to EconomPic, I recommend reading through this post as to what the GDP Deflator is AND how it can actually increase Real GDP relative to Nominal GDP if import prices rise).

In general, the price of imports were still rising during the third quarter, which means the import portion of the GDP Deflator decreased "real imports" relative to nominal imports. This in turn increased Real GDP relative to Nominal GDP in the quarter, but significantly less so than in previous quarters.

Looking forward to fourth quarter GDP growth, while many goods and services have decreased in price during the quarter (which will decrease the GDP Deflator), the GDP Deflator will not have the same "benefit" of higher priced imports. In fact, I suspect the huge drop in the price of oil will increase the size of the GDP Deflator from the latest quarter (i.e. a reversal of what happened in Q2 and Q3). This will be on top of what will likely be a negative nominal GDP figure.

In other words... in will not be pretty.

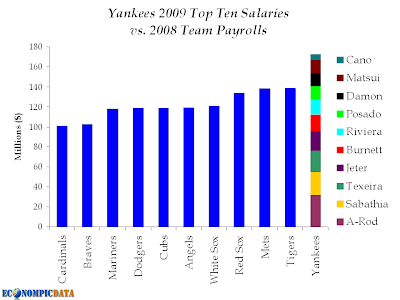
Another Reason to Hate the Yankees

The salary of the highest ten players on the Yankees vs. the highest team payrolls from 2008.

Yankees Suck

Seems bad... well try this one on. 12 teams had smaller payrolls than the combined salaries of just A-Rod, Sabathia, and Teixeira.


When will they learn that you can't pay for chemistry?

Housing Bubble Defined

Expect the Federal Government's outstanding debt to skyrocket in coming quarters / years.


Source: Federal Reserve (page 8)

Asset Price Declines, Wealth Destruction, and Federal Borrowing / Bailouts

The Federal Government's Flow of Accounts (hat tip Mish) shows a ton of detail related to just how much wealth has been lost in the past 12 months (through the third quarter). Per Mish:

$7.08 Trillion in wealth has vaporized in the past year. Figure 2008 Q4 to be as bad as Q3. If so, roughly $10 Trillion in household wealth will be vaporized in little over a year. And looking ahead, there is no reason to believe the stock market, the housing market, or the economy will show signs of recovery anytime soon.
Detailed below, we see that more has been lost ($7.7 Trillion), looking at just the holding gains / losses on assets over the past 12 months (R.100 Page 113).


Going back to 2004, we can see just how large a drop off this was (note that YTD 2008 we have seen losses across all the asset classes tracked).


Without cheap financing to prop up asset prices above sustainable levels... asset prices fall. Just think about it... home prices have fallen as individuals find it much harder to get a mortgage (if they even want one). A home buyer found it much easier to pay $500,000 for a home with no money down, than with the traditional 20% down.

This is exactly what has happened as corporations, investors, and banks are no longer able to lever their businesses, investments, or balance sheets due to a lack of available financing or losses they were forced to write down. Credit has all, but ceased with the HUGE exception being that for the Federal Government (data from F.1 page 17).

Thursday, December 25, 2008

Hotel Struggles

Ugly figures across "classes" of hotels.


I'm surprised with the performance of midscale hotels. I expected between downgrades from those previously going "upscale" on vacations / the business traveler, occupancy would be closer to flat.

I guess nothing should surprise me in this environment.

Source: Hotels Now via Infectious Greed

Wednesday, December 24, 2008

Personal Consumption; Necessities Reign Supreme

When forced to make a decision, consumers have shifted their consumption from goods (durable / nondurable) to services (see BEA - Table 1):


Looking deeper... it can be broken down between those items that are or are not necessities. In other words, consumers are likely passing on large purchases in order to maintain their lifestyles (i.e. clothing and recreation are close to flat), while they have actually increased real spending year to year on services like medical care and the upkeep of their homes.


Source: BEA

Corporate Profits Struggling

Ready for some ugly numbers? Well, according to the WSJ:

Corporate profits after taxes were revised a bit lower. After-tax earnings fell 3.2% to $1.300 trillion in July through September from the second quarter, the report showed. Profits previously were estimated falling 3.0%. Second-quarter earnings decreased 0.4%. Year over year, profits fell 10.1% since the third quarter of 2007.


Digging into the data, one can easily see the struggles corporations (and the public sector reliant on taxing corporate profits) are going through. The following sums it up:
  • Undistributed profits down 30+%, corporate profits and profits down ~10%
  • Taxes on income down (less profit to tax)
  • Cash flow down (less profits + expensive financing to replenish cash)
  • Consumption of fixed capital up (use it or lose it, fixed capital doesn't disappear)
Is there really any wonder why equities are down?

Source: BEA

A Continued Good Sign in Credit Markets

Swap spreads continue to "normalize". Don't understand and want to? Go here and/or here:

Tuesday, December 23, 2008

When Housing Became a "Serious Liability"

I was going to write something up, but Felix Salmon sums it all up best:

November is never a great month for home sales, but don't let that fool you: today's reports are truly gruesome, falling significantly short of very bearish expectations. New home sales, at an annualized rate of 407,000, are at their lowest level since 1991; existing home sales, which were running at a rate of over 7 million a year in 2005, are now down to less than 4.5 million.

The median home price in the US is now just $181,000 -- down from $215,000 as recently as June -- and total housing inventory for sale rose in months-supply terms (thanks to the drop in sales) and is now hitting all-time record levels of about one year's supply.


And here's the kicker:
All this is happening, remember, in an economy where roughly two-thirds of American households are owner-occupied. Owning one's own home, something which for most of this decade was a definite asset, is now a serious liability. Millions of workers can't move to somewhere with a better job market, and to make matters worse their net worth is now negative -- which means that no one will lend them any money, even if they are current on their mortgage payments.
Source: NAR

We're All Socialist Now...

Reported GDP would have been much worse had the government (Federal and State) not stepped in with spending and balance sheet. Per the BEA release:

Real federal government consumption expenditures and gross investment increased 13.8 percent in the third quarter, compared with an increase of 6.6 percent in the second. National defense increased 18.0 percent, compared with an increase of 7.3 percent. Nondefense increased 5.1 percent, compared with an increase of 5.0 percent. Real state and local government consumption expenditures and gross investment increased 1.3 percent, compared with an increase of 2.5 percent.


And this was only through Q3, before trillions of dollars in guarantees and cash were put into the system. As can be seen below, government spending at both the Federal and State level has continued its steady climb over the past 8 years.


Get ready for a spike. How large will it be? Well, according to the UPI:
With government spending accelerating with financial bailout funds and a possible economic stimulus package on the way, government's share of the economy is projected to exceed 25 percent of the nation's $14.4 trillion economy in 2009, USA Today reported Thursday.

The previous record in the post-World War II era was 23.5 percent, set in 1983. In 1943 and 1944, government spending hit 44 percent of the total economy.
Source: BEA

2008 Was Not the Year for M&A

Dealbook details how bad it has gotten in M&A:

“The thing about the last 12 weeks, … the world has completely changed,” Howard Lanser, director of mergers and acquisitions at investment bank Robert W. Baird, told Reuters. In the fourth quarter, merger volume plunged 44 percent, making it the lowest quarterly volume since the third quarter of 2004, Thomson Reuters data showed.


Based on those comments, it will be interesting to see how much worse this chart will look when 4th quarter figures are released (and it already looks ugly).

I do expect 2009 to be a huge year for M&A, if not just for firms to survive.

Source: Thomson Reuters

Wealth Concentration by State

Per the BEA:

Large counties, those with at least $10 billion in total compensation, represent 5.3% of the 3,111 counties in the U.S., but account for almost two-thirds (65.8%) of total national compensation. In these 164 counties, all metropolitan:

  • Total compensation grew by 5.5% in 2007, ranging from -0.6% in Montgomery County, Ohio to 12.4% in Collin County, Texas
  • Average annual compensation per job in 2007 ranged from $41,520 in El Paso, Texas to $116,977 in New York County (Manhattan), New York
  • The management of companies and enterprises sector had the largest rate of growth for total compensation in 2007 at 10.5%, while the agriculture, forestry, fishing, and hunting sector had the smallest rate of growth at 1.4%
  • The professional and technical services sector represented the largest share of 2007 total compensation at 10.8%


While this info is dated (doesn't 2007 seem like 20 years ago?), the above chart does show how concentrated the wealth is in the U.S.

Monday, December 22, 2008

Is the Bailout Hurting Pension Plans?

Interesting post over at the Peterson Institute by Jacob Funk Kirkegaard from last month (he nailed it) with the secondary effects of the bailouts / flooding of liquidity into the system on corporations pension plans and balance sheets:

As the financial crisis deepens, the world’s central banks and financial authorities have gained broad support for their efforts to reintroduce liquidity to the credit markets, get banks to lend again and bring down spreads and bond yields. But these sensible and indeed required steps to avoid a repeat of the 1930s may come with a drawback: a rapid decline in corporate bond yields, which threaten to produce rapidly rising funding shortfalls in defined benefit (DB) pension funds.
The reason is that the present value of these pension liabilities are discounted at roughly the yield of a AA Corporate bond. While markets sold off this year hurting plans, the plans did benefit from a higher AA Corporate rate (spreads widened significantly), which reduced the present value of their liabilities (i.e. future benefit payments).

Looking below at the 10 year AA bond yield over the past year, along with the present value for paying $1 million per year over the next 30 years at this rate (this is obviously a simplified version of the "real world") we can see that the cost of liabilities has bounced back significantly (~20%) over the past few months. In other words, corporations reporting with a 12/31 year end vs. a 9/30 year end will show two very different sets of liabilities, which directly impacts their balance sheet.


Back to Jacob:
In today’s financial crisis, US corporations and state and local governments with a DB pension plan have so far been hit in different ways. The large recent declines in global stock markets have hit pension plan asset valuations hard, and without doubt the Pension Protection Act (PPA) of 2006 (for corporations) as well as the gradual introduction of accrual accounting methods for state and local government pension funds by the Governmental Accounting Standards Board (GASB) will require future increases in pension plan sponsors’ pension contribution levels.

30 Year Swaps Flat to Treasuries

We've detailed the odd occurrence a few times at EconomPic of the 30 Year Swap trading through Treasuries (implies that banks can borrow at a lower rate than the U.S. government). This has whipped back over the past few weeks and today has traded a 0 bps to Treasuries.


I won't declare victory in credit markets just yet, but it is a good sign.

Bank Valuations --> Then and Now

Details per Tom Lindmark:
A year ago, ABN (ABN) was purchased by Royal Bank of Scotland (RBS) with some help from Fortis, Santander (STD) and Bank of America (BAC). The purchase price was $100 billion approximately. The chart dismally shows what you could buy today with that money. Once again, the people that should have known what something was worth, what the assets on the balance sheet were truly worth, vastly overpaid. It’s stunning.


Source: The Big Picture

Friday, December 19, 2008

Real Mortgage Rate is Not So Nice

The below shows the daily mortgage rates less the implied 7 year inflation rate (assumes the average life of a mortgage is ~7 years). This is much less encouraging than my earlier post.

Mortgage Financing on the Cheap... Will It Work?

Bloomberg reports:

The average rate on a fixed 30-year mortgage fell to 5.18 percent last week from 6.47 percent in October, according to Mortgage Bankers Association data.
Looking at daily data, I'll go ahead and project that next week's figure will look much better. After the Fed announced Tuesday they would be buying mortgages, rates tightened another 60-70 bps to a rate of ~4.4% (according to Barclays)!


Funny thing is... at this point the rate cut to prop up housing feels an awful lot like OPEC oil cuts to prop up the price of oil, with the obvious difference being trying to stimulate demand vs. halt supply?

My question... will either work in the short run?

Dollar Crushed

UPDATE:
Mosaic of the Mind asked:

Why would there be such a reversal while the American markets have "rallied"?
My response (I'd love feedback):
When markets sold off / dollar rallied in Sept-Nov it was due in large part to levered investors (ie. hedge funds) that were forced to sell off their positions. The dollar has been used as a carry trade (investors borrowed cheaply in dollars then exchanged these dollars for the local currency of their investment).

One example is Russia, where many investors borrowed in dollars, exchanged for Rubles (hence Rubles had rallied) and invested in Russia. Then from Sept-Nov, ~$100 billion in "hot money" was pulled and these investors closed their dollars / ruble positions to close their dollar borrowings (Russia may actually be a bad example as their dependence on oil is causing magnificent problems now... but ignore them for this thought experiment).

One can assume that the majority of this unwind ended ~Nov. 20th (though I think this is just the first wave). Now that these trades are unwound and equity markets have rallied, there is no longer the need or demand to buy dollars to close such trades. Thus, the dollar has sold off after being overbought due to:
  • The end of this unwind
  • The incredibly low interest rates, which will likely stimulate another wave of carry trades
Get ready for additional waves / volatility as leverage continues to work its way through the system.

Click chart for larger image:


Source: Investment Postcards

State Revenue Down in Q3... Just Wait til Q4

Rockefeller Institute details:
State tax collections continued their downward trend in the July-September quarter, according to preliminary data the Rockefeller Institute of Government gathered from 42 states. Total taxrevenue for these states was essentially flat, rising by 0.1 percent over the same quarter last year. That rate of change was down sharply from the 50-state growth rate of 3.6 percent in the April-June quarter, and 17 states reported declines in total tax revenues from the same quarter of 2007. After adjusting for economy-wide inflation of 2.7 percent, real tax revenue declined by 2.6 percent nationally and was down in 31 of the 42 states.

Thursday, December 18, 2008

Leading Economic Indicators Point to Worsening Economy

Conference Board:

The leading index continued to fall in November, due mainly to large declines in building permits, stock prices, and initial unemployment claims, which offset the continued positive contributions from real money supply (M2) and the yield spread. Without the very large increases in inflationad justed money supply since September, the leading index would have been significantly weaker. The six-month change in the leading index has continued to fall -- to -2.8 percent (a -5.6 percent annual rate) in the period through November, down from -0.9 percent (a -1.7 percent annual rate) during the previous six months. In addition, the weaknesses among the leading indicators have remained widespread in recent months.

Regional Personal Income Breakdown: No Stimulus Here

According to the BEA:

The third quarter personal income growth was the weakest for the nation since the first quarter of 1994 and contrasts with the 1.6 percent increase in the second quarter of 2008. State personal income growth rates in the third quarter ranged from a 1.4 percent increase in Wyoming to a 1.6 percent decrease in Mississippi.

The lack of personal income growth in the third quarter reflects the concentration of Economic Stimulus Payments in the second quarter. Only $5 billion in economic stimulus payments were made in the third quarter, down from $113 billion in the second. This decline offset increases in the other components of personal income.

Who Wants to Receive 2.5% / Pay LIBOR for 30 Years?

This is an update of a previous post (for full details of the technical factors go to that link).

Across the Curve details:

Swap spreads moved wildly. The 2 year spread narrowed 6 basis points to 82. Three year spreads tightened 7 ¼ basis points to 76 ¾ basis points. Five year spreads narrowed 1 ¼ basis points to 70 basis points. Ten year spreads moved wider 17 basis points to 17 ½ basis points. Thirty year spreads widened 20 basis points to NEGATIVE 22.


While a ~50 bp rebound in this measure over a few days is BIG, at some point in the near future I expect a much more violent rebound towards zero as the realization that paying a floating rate and receiving 2.5% over 30 years has a ton of risk and the flight to short-term Treasuries unwinds.

Real GDP Declines in Recessions


Source: Gary Shilling via John Mauldin

Wednesday, December 17, 2008

Housing Starts Down... Housing Stocks Up

Bloomberg reports:

U.S. builders broke ground in November on the fewest new homes since record-keeping began, signaling the housing slump will extend into a fourth year.

Construction starts on housing fell 18.9 percent last month to an annual rate of 625,000 that was the lowest since the government started compiling statistics in 1959, the Commerce Department said today in Washington. The annual rate was lower than all 70 estimates in a Bloomberg survey of economists.
Looking at data from the Census we see that new starts are now down ~50% since last November.


Ignore that jump in the Northeast last June. As Forbes reported:
Multi-family housing starts in New York City fueled a spike in June of the number of building permits and overall housing starts, according to a report published by the United States Commerce Department on Thursday.

The government said the number was deceptively buoyed by a zoning rule change in New York. If you exclude multi-family data in the Northeast, starts actually fell by 4.0%.
So with all this gloom, housing stocks must have been hit... WRONG. Not when the Government is handing out money!!!! Lets go to Marketwatch:
U.S. housing starts plunged to record lows in November as the residential real estate bust persists.

However, builder stocks jumped Tuesday along with the broad market after the Federal Reserve said it will use every tool at its disposal to get the economy back on its feet.


While I don't necessarily understand a rally on the same day as these reported stats (unless investors think this is the bottom... again), I do at least see one bright spot for homebuilders. When these huge "stimulus" infrastructure projects begin, who do you think will be more prepared to help... bankers or homebuilders?

Dollar Carry Trade Version 2.0

I detailed just over a week ago that I was not bearish on the dollar long term, but...

I do think some / a lot of the move we've seen over the past few months was largely due to the deleveraging of global investments, and I do expect that to reverse in the coming months.
And here we go...


I actually see this as a positive sign that global markets are returning to some normalcy. When interest rates are practically zero and the printing press is in the process of being warmed up, investors SHOULDN'T WANT TO INVEST in the dollar.

Breakeven Inflation... How Low Can We Go

Bloomberg details:

The decline in inflation has driven the 10-year breakeven rate, the difference in yields between 10-year Treasury Inflation Protected Securities and comparable U.S. notes, to 0.13 percentage point, near the narrowest since the government started selling TIPS in 1997.

“The near-term deflationary forces are here in the numbers, and it will remain that way for the next several months,” said Kevin Flanagan, a Purchase, New York-based fixed- income strategist for Morgan Stanley’s individual-investor clients. “From an inflation standpoint, the kind of numbers we are seeing will not take us to levels outside of the realm of where we are now.”


Several months is a heck of a lot different than 10 or even 30 years. While I feel TIPS aren't cheap, next to Treasuries they look like bargains.

Ecuador Defaults... "We Borrowed, but Now Feel it is Immoral"

Reuters reported yesterday (not a surprise... the bonds have been trading at 30 cents on the dollar):

Ecuador will not pay interest on its 2015 global bonds on time, Finance Minister Elsa Viteri said on Monday, as the market wondered if the country was leaving open the chance of honoring that debt.
AND, as Rakesh Saxena reports it is not due to the inability to pay:
The sovereign debt market is still unable to appreciate the fact that President Rafael Correa's decision to formally default on its foreign obligations on Monday is rooted in ideology, not in any shortage of funds. The ideological premise, that Ecuador's borrowings from international lenders are tainted by corruption and are thus "immoral", is certain to gather momentum in 2009.
This type of risk is very difficult to measure. Back to Rakesh:
Those diminishing the impact of Ecuador's default (on $3.9 billion of global bonds) may be failing to grasp the fact that both, a significant component of the sovereign debt matrix and South American equities, are now subject to political risks which are extremely difficult to quantify.
And default has been a common outcome for Ecuador (chart via data from 'Serial Default and the “Paradox” of Rich-to-Poor Capital Flows (2004), C. Reinhart and K. Rogoff' via Infectious Greed:

Tuesday, December 16, 2008

Goldman Earnings Hit, Pay Down to a Puny $395,000 per Employee

Marketwatch (bold mine):

Goldman Sachs paid its average employee sharply less in fiscal 2008 than in 2007 amid one of Wall Street's most dismal years ever. Speaking to reporters on a conference call Tuesday, Chief Financial officer David Viniar said, "compensation will be significantly lower this year (FY 2008)." Earlier, Goldman reported its first ever loss as a public company. When it reported those results, it also reported that its average compensation per employee in 2008 fell to about $395,000, down sharply from more than $660,000 in fiscal 2007. And, the firm said it set aside $10.93 billion for total compensation and benefits in 2008, down 46% from $20.19 billion a year ago.