Showing posts with label secret sauce. Show all posts

Monday, April 2, 2012

Baby's Got Sauce... Checking in on the World's Greatest Rotation Strategy

Definitely not the world's best strategy, but I thought I'd try out a headline grabber. In fact, there is no legit reason I can think of that explains why this seasonal pattern should outperform going forward, BUT the results (both in and out of sample) are good enough that I won't be ignoring them.


I planned to provide an update on the "Secret Sauce" allocation strategy as soon as I started seeing all the "sell in may, go away" articles that always come this time of year. I didn't have to wait long.

To Marketwatch:
Those interested in doing some spring cleaning in their portfolios this month might be tempted to do the most radical spring cleaning of all: Sell everything and go to cash.

That’s because April represents the end of the seasonally favorable six-month period that began last Halloween, and the fast approach of the time when many will “Sell in May and Go Away.”
Which brings me to the Secret Sauce, amazingly now in its 5th year of in sample testing.

What is the Secret Sauce?

An alternative to the "sell in May, go away" strategy, Secret Sauce is sell the S&P 500 in May and then invest in the Long Government / Credit bond index (rather than sit in cash). The "strategy" takes advantage of data mining that showed the Long Government / Credit index outperformed the equity market for the May through October time frame over the 34 years between 1974 and 2008.

The amazing thing is that since I first revealed the Secret Sauce back in July 2008, the results keep getting better. The massive outperformance since 1974 (14.7% vs 10.6% annualized returns) with lower volatility (12.4% vs 15.8% monthly standard deviation) was met by even larger outperformance over the past few years (35.6% vs 8.5% returns over the last 12 months, 11% vs 2% annualized over the last five) resulting in $1 invested in the Secret Sauce in January 1974 now being worth $188 vs. $1 in the S&P 500 being worth $47.5 (assuming no fees, transaction costs, or taxes).


And the strategy's theme song... G Love & Special Sauce with 'Baby's Got Sauce'


Source: S&P / Barclays Capital

Monday, October 24, 2011

On the Seasonality of Equities

EconomPic has outlined the seasonal performance of the equity market (with a "secret sauce" twist) a number of times (most recently here).

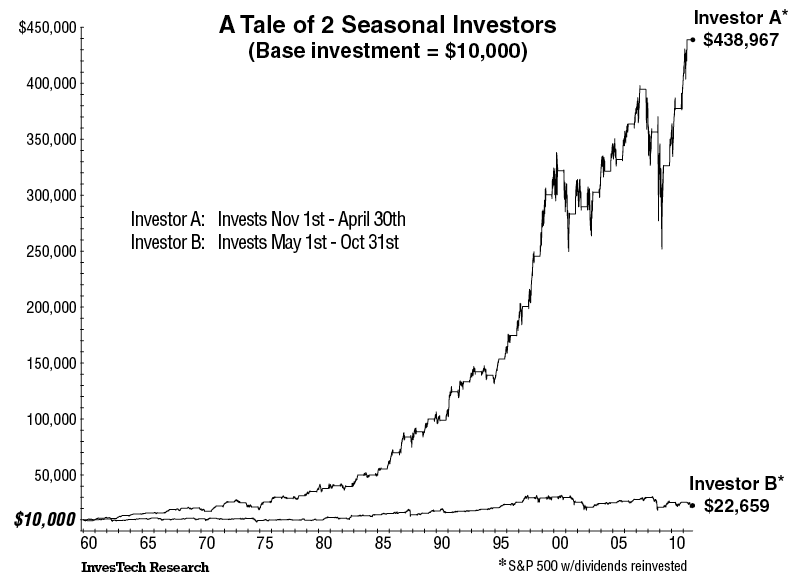
The Big Picture details equities seasonal phenomenon since 1959:
Here are the specifics of seasonality: Imagine we start with two $10,000 accounts, and use them to make investments in an S&P 500 Index fund. One account invests in one 6-month period, the other invests in the remaining 6-month period. Account A is invested from November 1st through April 30th each year, while Account B is invested from May 1st through October 31st.
Here are the numbers:

• Account A portfolio grew from $10,000 to over $438,967. That is a 42-fold increase.
• Account B portfolio barely doubled to $22,659.
A chart outlining the above phenomenon going back to 1959 can be found here, but I thought I'd take some alternative looks.... one that goes back further in time (all the way to 1871) to see when this seasonality started and one taking a look at the real return (i.e. after inflation) of each leg since 1959.

140 Year Rewind

Using S&P data from Professor Shiller's Irrational Exuberance site, I constructed the below chart going all the way back to 1871. The outperformance of the November - April time frame since 1959 can be seen, but interestingly enough before that date both periods had almost the exact same performance. Begging the question... what changed around 1959?


Real Seasonality (1959 - 2011)

You thought the original May - October figure looked bad in nominal terms? After inflation, total returns for that six month period over 52 years (312 months) were negative, while the November - April time frame posted annualized real returns ~10%.


Monday, May 9, 2011

Secret Sauce Continues to Grip It and Rip It

The secret sauce was first revealed back in July 2008 when I had about 50 readers (and had no idea how to make charts "pretty").

What is the secret sauce? An alternative to the "sell in May, go away"; sell the S&P 500 at the end of May and then invest in the Long Government / Credit bond index (rather than sit in cash). The "strategy" (I wouldn't necessarily call it that) takes advantage of data (mining) that shows the Long G/C has outperformed the equity market for the May through October time frame. The result is better annualized performance (14.1% vs. 10.7%) with less volatility (12.1% vs. 15.8% standard deviation).

Growth of $1 (log chart shown last year here).


Rolling Ten Year Performance


Source: Barclays Capital, S&P

Wednesday, July 23, 2008

The Secret Sauce Revealed...

There was a guess that the 'Secret Sauce' was a Corporate Bond Index and one that the 'Secret Sauce' was instead a Treasury Index. As these (actually a combination of the two in the form of a Long Government / Credit Index) formed the 'Secret Sauce', I thought I'd take a look at how well these two security types have performed relative to one another...

The results actually surprised me. While there were somewhat large year to year variations, since 1973 the cumulative returns are remarkably close.