Showing posts with label Rates. Show all posts

Tuesday, December 14, 2010

When Will the Fed Hike?

The chart below shows market forecasts for short-term rates (3 month LIBOR) over the next three years based on EuroDollar futures contracts. As can be seen, the market is projecting a steady increase in short-term rates with an increase in the pace in mid-2012.


Markets have moved from 'Fed on hold for years' to 'Fed on the verge' abruptly since early November. While the chart above shows a snapshot, the chart below shows the trend of what the market is / has priced in for the one year Treasury yield, two years forward (bootstrapped from 3 year and 2 year Treasuries).

Note that current 1 year Treasuries are 0.27%, while the forward rate has jumped ~130 bps to ~2% since the first week of November.


With core inflation negligible, unemployment at 10%, and excess capacity still very... excess, this is definitely way on the optimistic side of my personal forecast.

Source: Federal Reserve

Wednesday, September 8, 2010

Mortgage Rates and Housing Prices

David Leonhardt at NY Times Economix (hat tip Calculated Risk) discusses the relationship between mortgage rates and housing prices:

Anyone who argues that home prices do not seem headed for another big decline will probably hear some version of this question. Interest rates are historically low right now. They will surely rise at some point. All else equal, higher rates should push home prices down.

Yet compare the national median home price to 30-year fixed mortgage rates over the last three decades (with both indexed to 1 in 1971)
And shows the following chart:


And concludes:
It’s not easy to see much of a relationship. The fall in rates appears to have helped the housing boom of the last decade. On the other hand, the spike in rates in the 1980s had little apparent effect on prices.

My best guess for why the two don’t correlate more closely is the role that psychology plays in housing markets. Prices just don’t move as quickly as economic theory suggests they should.

My immediate thought... why are you comparing REAL price levels with NOMINAL rates?

Lets see the relationship of real housing prices (in this case Case Shiller discounted by CPI) vs. real mortgage rates less year over year CPI (note that the right y-axis is flipped to show the inverse relationship between the two).


A much stronger relationship appears when viewed on a real to real basis.

Note that the relationship appears to be non-existent from around 1972 to 1980 (pre-Case Shiller index data), which can be explained in part that government agency mortgages (i.e. subsidized financing rates that made housing affordable on a monthly payment rather than price level basis) jumped from just 10% of the market in 1980 to almost 50% by 2000 (see page 5 of the Fed's paper Securitization and the Efficacy of Monetary Policy for more).

Calculated Risk seems to vehemently disagree with my view that there is in fact a relationship between rates and price:
I've tried to explain this several times in several different ways. Price is what you pay for something. Interest rates are related to how the item is financed. Some people pay cash for a house. Would they pay more because interest rates are low? Nope.
My disagreement to his disagreement can be found in last month's post The Importance of Mortgage Rates, but his argument is in a nutshell the following question:
Would people pay more for a car if interests rates are low?
My simple answer to that question... OF COURSE (and I did for my first car from a sleazy used car dealer).

Why? Because I could not afford to pay cash for the full price of a car at the time, thus I paid with credit, rather than fiat money (we live in a credit, not a fiat economy - see Steve Keen's epic piece that changed my understanding of the economic collapse here for more).

Details of my first car purchase:
  • 1990 Dodge Shadow (yikes)
  • Cost: ~$3200
  • Savings available for a car = ~$0
  • Monthly disposable income available for a car = ~$100 / month
Without financing, I could not afford the car I ended up with. With financing, I was able to afford it across a range of sticker prices, depending on financing rates, all at the same $100 / month payment. And unlike case-by-case deals on auto rates, anyone with decent credit and 20% down (harder to come by these days, but not limited) can access the subsidized mortgage rate.


Which brings me back to my conclusion in my post on rates and housing:
Since the key contributor to housing affordability is not the current list price, but rather the mortgage rate, anyone looking to buy should seriously consider the alternative (i.e. renting) if they don't plan to use that contributing factor (again... the mortgage rate) for the life of the loan (i.e. to keep their house for 15-30 years).

If you do plan to buy a house for a smaller window of time (i.e. 1-10 years) with the idea of flipping it into a larger house, be careful. That per month clearing price may mean a much lower home value when you are trying to sell...

Source: S&P, BLS

Tuesday, September 7, 2010

On the Value of Treasuries

In recent weeks, a number of investors I respect have commented that Treasuries are rich and should be avoided (or even outright shorted). Recent examples include Doug Kass and James Montier, both of whom claim current yields put too much weight on expectations of a double dip. I simply don't agree...

While I am not a Treasury bull, it is my view that at a 2.7% yield Treasury bonds are fairly valued when one takes into account the low growth / low inflation outlook, the Fed's extended easing policy, and the potential for capital appreciation rolling down the steep yield curve. Below we'll take a look at these three points in more detail.

Point #1) Nominal Growth Matters

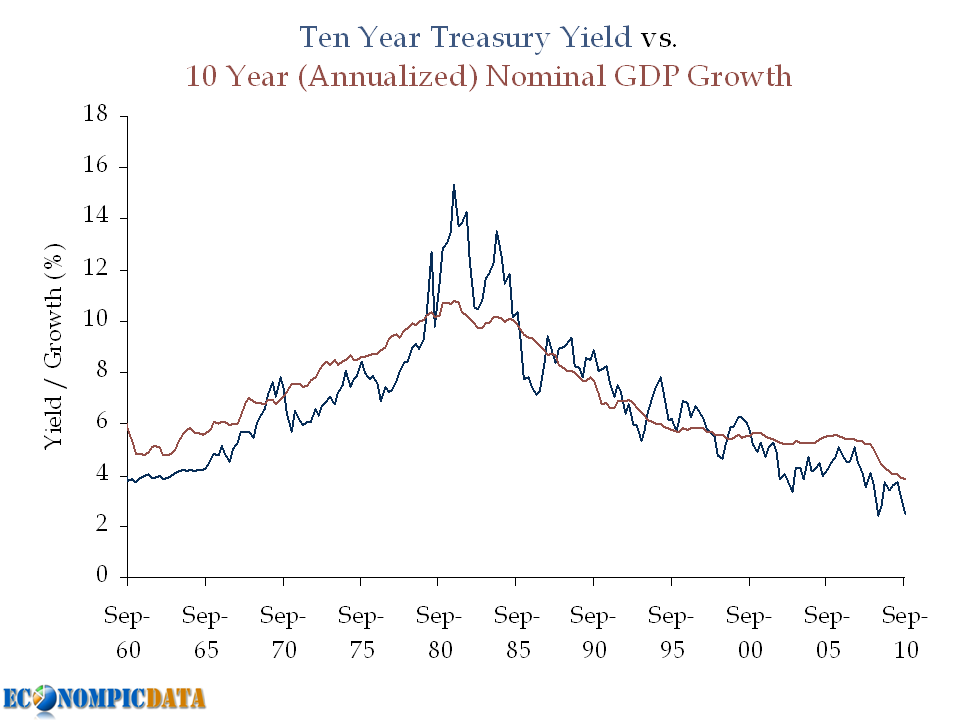
This point was first shown in the following chart a few weeks ago.


In Doug's post he compares historical real GDP to Treasury yields and notes that bonds should be yielding more (he notes that Treasuries have historically yielded ~360 bps more than real GDP). The problem with this analysis outside of an apples (real GDP) to oranges (nominal Treasury yield) approach, is that a large portion of this "spread" was due to the inflation spike seen in the chart above during the late 1970's / early 1980's; a period marked by high nominal Treasury yields and low real GDP.


Point #2) The Importance of Monetary Easing Policy


A bond investor that does not take duration risk can only earn VERY low rates over the next few years as long as the Fed is on hold. If an investor earns VERY low rates for each of the next two years, they will need to earn a much higher return for the remaining 8 years just to break-even with the Treasury investment. The key is that the market is pricing this in.

Example:

Assuming a "zero" interest policy for two years (by zero, lets assume 0.25%), this means that a 2.7% yield can be achieved as follows:

  • The first 2 years at 0.25%
  • The last 8 years at 3.32%
The formula: (1 + 2.7%)^10 / (1 + .25%)^2 = 1.29878^(1/8) = 3.32%
The chart:


The relevance? The market is not forecasting rates will stay as low as they are now (i.e. forward rates are higher... closer to that 3.32% rate than 2.71%), which means capital losses will not happen simply if rates rise from current levels, but rather rise above levels expected by the market going forward.


Point #3) Don't Forget the Rolldown


The yield curve is VERY steep (i.e. upward sloping). This means that the 10 year bond will not only return its yield over the next 12 months if nothing changes (i.e. if the yield curve is exactly where it is today in 12 months), it will return more.

How much more?

Using current figures, the 10 year Treasury is yielding 2.71% while the 9 year Treasury is yielding 2.54% (17 bps difference). Assuming that nothing changes, performance of a 10 year bond over the next 12 months will be made up of the 2.71% yield plus the capital appreciation from moving from a required yield of 2.71% to 2.54% (i.e. a bond with a 2.71% coupon and a required yield of 2.54% will be worth more than par). This specific 17 bp move would add an additional 1.5% (assuming a duration of 8.75 years on a ten year Treasury) over the next 12 months, which means a 4.2% return for the 10 year note if nothing changes.


Source: Federal Reserve / BEA

Thursday, April 1, 2010

Explanation of How a Zero Boundary Causes a Steep Yield Curve

This post will hopefully explain Paul Krugman's great interpretation of the yield curve... it's caused by the zero bound on the front-end of the curve. First to Paul...

As I tried to explain last time, to a first approximation you can think of the long term rate as reflecting an average of expected future short-term rates. Short-term rates, in turn, tend to reflect the state of the economy: if the economy improves, the Fed will raise short-term rates, if the economy worsens, the Fed will cut. So long-term rates can be either above or below short rates.

Except that now they can’t. If the economy improves, short rates will rise; but if it worsens, well, they’re already zero, so there’s nowhere to go but up. This implies that there has to be a positive term spread.

At first this confused me and apparently I was not alone. Crossing Wall Street details their personal misunderstanding:
Where I really lose Krugman is when he seems to imply that the steep yield curve is the result of nominal short rates being near zero. I have no problem accepting that the curve should be positive but I don’t get how that ought to impact its unusual steepness. After all, the two-ten spread recently hit an all-time record.
Lets see if I can explain with an example and (of course) a few charts.

Yield Curve Due to Zero Bound Rates

Assuming longer term rates only reflect futures expectations of rates, lets also assume there is no view of interest rates... an investor thinks that for each period from here on out, there will be a 50% chance of a rate hike and a 50% chance of a rate cut (lets assume 25 bps).

Non-Zero Bound

If the Fed Funds rate was 4%, then next period will either be 3.75% or 4.25%. The period after that 3.5% or 4% (if there is a cut period 1) or 4% or 4.5% (if there is a hike in period 1). In this case there is no expectation of a yield curve steepening because each possibility is as likely (a 50 bps drop in 2 periods or a 50 bps hike in 2 periods). The four outcomes are 4% (cut, hike), 4%, (hike, cut), 3.5% (cut, cut), or 4.5% (hike, hike). An average of.... 4% (i.e. rates went nowhere on average).

Zero Bound

This is where things get interesting. The Fed Funds rate is zero. They cannot go negative. Thus, flip your coin for a 25 bps hike or cut. If you get hike, rates rise to 25 bps. If you get a cut... well, you can't cut any more. Go to period two. Now under the initial hike, rates can go back to 0% or jump to 50 bps. Under the initial cut, they can only go to 25 bps or stay at 0%. Thus, the four outcomes in period 2 are 0, 0, 25 bps, and 50 bps. An average of 18.75 bps (they went up).

Analysis

Starting at the zero bound and running this same scenario for 200 periods (and averaging the outcome of 15 samples), we get the following outcomes.

Example 1

Example 2

Running this hundreds of times (built a nice little spreadsheet I must say), the charts all looked roughly the same (just different scales).

I hope this was helpful...

Thursday, February 18, 2010

Fed Raises Discount Rate... More "Unwind" in the Future?

The Fed raised the Discount rate (not the Fed Funds rate) to 0.75% per Calculated Risk.

Just to be clear, this is the discount rate (this is the rate the Fed charges banks that borrow reserves) and not the Fed Funds rate. This move was being discussed for some time although the timing is a surprise.
Regardless, the bond market sold off in an expected, non-expected manner (nobody expected it today, but given the surprise hike shorter rates sold off more than longer rates in what would be an expected fashion).


Why expected?

Short rates are more directly impacted (on a relative basis) by expectations of Fed hikes, whereas longer rates are more directly impacted (on a relative basis) by future rates, (thus expectations of inflation). This removal of liquidity from the system may mean the Fed is more likely to hike Fed Funds sooner (I don't buy that aspect of it), while inflation concerns may be less justified with less liquidity in the system.

What to expect now?

Besides the obvious answer "the unexpected", remember that renormalization following the unwind? Expect that unwind to be back in play.

Source: Bloomberg

Thursday, January 8, 2009

Bank of England Cuts to Lowest Rate Since 1694 Inception

Bloomberg reports:

The Bank of England cut the benchmark interest rate to the lowest since the central bank was founded in 1694 as policy makers tried to prevent the credit squeeze from deepening Britain’s recession.

The Monetary Policy Committee, led by Governor Mervyn King, trimmed the bank rate by a half point to 1.5 percent. The result matched the median forecast of 60 economists in a Bloomberg News survey. The pound rose against the euro and the dollar.

Thursday, December 18, 2008

Who Wants to Receive 2.5% / Pay LIBOR for 30 Years?

This is an update of a previous post (for full details of the technical factors go to that link).

Across the Curve details:

Swap spreads moved wildly. The 2 year spread narrowed 6 basis points to 82. Three year spreads tightened 7 ¼ basis points to 76 ¾ basis points. Five year spreads narrowed 1 ¼ basis points to 70 basis points. Ten year spreads moved wider 17 basis points to 17 ½ basis points. Thirty year spreads widened 20 basis points to NEGATIVE 22.


While a ~50 bp rebound in this measure over a few days is BIG, at some point in the near future I expect a much more violent rebound towards zero as the realization that paying a floating rate and receiving 2.5% over 30 years has a ton of risk and the flight to short-term Treasuries unwinds.

Thursday, December 4, 2008

Global Rates Slashed

England cut rates a full 100 bps. According to the Bank of England this was done


The Bank of England’s Monetary Policy Committee today voted to reduce the official Bank Rate paid on commercial bank reserves by 1.0 percentage points to 2.0%.

In the United Kingdom, business surveys have weakened further and suggest that the downturn has gathered pace. Consumer spending and business investment have stalled, while residential investment has continued to fall. Activity indicators in the rest of the world have also weakened, though the further depreciation in sterling should moderate the impact of weaker global growth on the United Kingdom.


The ECB followed suit, slashing rates 75 bps.

Wednesday, November 26, 2008

Some Swap Spread Normalization...

Bloomberg reports:

The difference between the two-year swap rate and the benchmark Treasury note yield, known as the swap spread, narrowed to 94.5 basis points from 112.25 yesterday. The 17 percent drop is the biggest one-day decline since September 2003. Swap spreads with maturities from three through 30 years were down between 8 basis points and 14 basis points.

Thursday, November 6, 2008

Bank of England Has Some Catching Up to Do

Per Bloomberg:

The Bank of England unexpectedly cut the benchmark interest rate by 1.5 percentage points to the lowest since 1955 as policy makers tried to limit damage caused by the worst banking crisis in almost a century.

The nine-member Monetary Policy Committee, led by Governor Mervyn King, reduced the bank rate to 3 percent, the biggest single step in more than a decade. The move was predicted by none of the 60 economists in a Bloomberg News survey.

Monday, October 20, 2008

Frozen Markets Become Slushy: LIBOR Down

Per Across the Curve:

Three month libor has plummeted 36 basis points to 4.02 percent this morning. My money market correspondent thinks that by the time the week is over three month Libor will have posted declines of about 100 basis points.


Source: ATC

Thursday, October 9, 2008

Are Equities the Least of Our Worries?

Per Paul Krugman:

Stock prices are, however, the least of our worries. The money markets are frozen; the TED spread is 4.14%.

G7 meeting tomorrow, IMF-World Bank over the weekend. Now is the time for major action — an announcement of coordinated capital injections, liquidity measures, and more. If we’ve had nothing except vague assurances by Monday ….
I'd have to agree. Equity market crashes are painful. No credit market = no global economy.


Wednesday, October 8, 2008

Global Response...


Fed Funds Cut to 1.5%... Will It Matter?

The cost of borrowing for investment grade corporations has skyrocketed in recent months to a whopping 6% above the Fed Funds rate.


Will the rate cut matter?

Sunday, August 10, 2008

The Fed's (Lack of) Impact on Rates


Source: Jim Bianco of Bianco Research via Naked Capitalism.

Thursday, July 31, 2008

Rate Hikes / Cuts Haven't Impacted Inflation

Why Low Rates in the U.S. Haven't Impacted Inflation

Yves pointed out at Naked Capitalism:

Yes, negative real interest rates normally lead to speculative investment. But pray tell who is getting credit in the US now? Consumers most certainly aren't, businesses have it tough, the mortgage market depends on Federal guarantees, and by all accounts, the credit markets are having liquidity issues in many sectors. We saw a different version of this phenomenon in the S&L crisis: the prime rate wasn't all that bad, but it was irrelevant because just about no one could borrow in any meaningful size.
Why High Rates in Europe Haven't Impacted Inflation


Ambrose Evans-Pritchard points out:
For once I find myself in total agreement with France's Nicolas Sarkozy, who said the EBC rise was "at best pointless, at worst counter-productive." This is now plain to anybody who steps outside the Frankfurt Eurotower and takes the pulse of the -- collapsing -- credit and equity markets.

If the rate rise pushes the euro higher against the dollar, it will merely push oil higher as well -- since oil is trading as inverse dollar with seven times leverage. Eurozone inflation" -- that treacherous term -- will get worse. Brilliant.


As can be seen above, the difference between the Fed Funds rate and the European Central Bank's target rate generally predicted the future inflation variance between the U.S. and Europe (as defined by the difference between Consumer Prices in the U.S. and the Haromonized Index of Consumer Prices in Europe). From 1998 - early 2007 each Central Bank acted "ahead of the curve". The Fed took the lead either cutting or raising rates and the ECB followed.

Since mid-2007 the U.S. has cut the Fed Funds in dramatic fashion believing slow growth would inevitably deter inflation, while the ECB felt inflation could be stamped out with higher rates. Thus far, it looks like neither situation has worked out to eithers liking as the difference in inflation between the two areas has been negligible (the U.S. has seen inflation tick up 2.7% to 5.1%, while the Eurozone has seen inflation rise 2.3% to 4.1%).

Friday, July 25, 2008

S&P: Fannie Subordinated Debt Holders May be In Trouble

Per Dealbreaker:

Will the government's bailout of Fannie Mae and Freddie Mac wipe out holders of their preferred stock and subordinated debt? That's what S&P warned today with its statement that it was placing these instruments on a negative credit watch pending a review of the legislation on Capitol Hill.

"Although there is still ambiguity on the part of regulatory authority as it applies to how nonsenior creditors of Fannie Mae and Freddie Mac would be treated if the U.S. Treasury ever acted on its three-point liquidity plan, the language in HR 3221 increases the likelihood that subordinated debtholders and preferred stockholders would face greater subordination risk," S&P's analyst wrote.


Update: Yves over at Naked Capitalism points out the downgrade:

Validates some of the critics' worries about Fannie and Freddie but also signals the possibility that not only shareowners could be wiped out, but even preferred stockholders and sub debt owners are exposed even with the government rescue effort. Put more simply, this move the view that the firms are undercapitalized.

Thursday, July 3, 2008

ECB vs. the Fed

Interesting take on this over at Naked Capitalism