Monday, February 16, 2009

Japanese Economy Crumbling

FT Alphaville reports:

Japan’s economy shrank at an annual 12.7% pace last quarter, the most since the 1974 oil shock, as recessions in the US and Europe triggered a record drop in exports, reports Bloomberg. GDP fell for a third straight quarter in the three months to Dec 31, down a quarterly 3.3%, the government said Monday in Tokyo. Exports plunged an unprecedented 13.9% from the third quarter as demand for cars and televisions collapsed amid a slump that the G7 nations said will persist for most of 2009.


Source: ESRI

Friday, February 13, 2009

EconomPics of the Week (Valentine's Edition)

Asset Classes
Oxymoron of the Day: S&P Earnings
Equity Markets: Expect Volatility
S&P 500 on a Five Month Rally? Just Ignore the First Half of the Month
LIBOR Has Come a LONG Way

Economic Data
Business Sales and Inventories (December)
Euro Region GDP Down 1.5%
European Industrial Production (December)
Retails Sales Bounce 1% MoM, Down 10% YoY
U.S. Trade in Goods Crashing = Contraction of Trade Deficit
Wholesale Inventories Rising Dramatically
Same Store Sales (January)
Revolving Credit Free Fall

Banks
Merrill $3.6 Billion Bonus Breakdown
Bailout of Securitization Market = Bailout of Banks
Yen Shopping Spree Finally Here?

Bailout
Moody's: The United States is Resilient... Not Resistant to Downturn
Treasury Budget Soars
Real Treasury Yields Moving Lower
TARP Review: Taxpayers Paid too Much
The Case for Nationalization?

Other
Great Depression II = Rock n' Roll
A-Rod: "It was Such a Loosey-Goosey Era"

Oxymoron of the Day: S&P Earnings

Calculated Risk details the S&P 500 will report its first ever quarter of negative earnings (expectations are for a loss of -$10 per share).


Even excluding financials the figure is expected to be negative.

Calculated Risk asks:

What is the P/E for that?
Source: S&P

Merrill $3.6 Billion Bonus Breakdown

Andrew Cuomo writes Barney Frank (hat tip Paul):

Merrill Lynch's decision to secretly and prematurely award approximately $3.6 billion in bonuses, and Bank of America's apparent complicity in it, raise serious and disturbing questions.
In the letter there are details regarding the breakdown of that $3.6 billion, which I've attempted to breakout further (there is some rounding and assumptions involved, but in general it is what it is).

Total Breakdown


Average by Tier (not sure how clear this is... I couldn't think of a better way to show it)


Source: NY State

Business Sales and Inventories (December)

LA Times reports:

Inventories at U.S. businesses fell more than forecast in December and the most since 2001 as companies responded to slumping sales that reflect a deepening recession.

The 1.3 percent drop in the value of unsold goods at factories, retailers and wholesalers followed a revised 1.1 percent decline in the prior month, the Commerce Department said today in Washington. Sales fell 3.2 percent after a 5.7 percent decline in November.

So while inventories are shrinking at a rapid pace, sales are falling even faster.

Looking over a longer time frame (year over year, rather than month over month) we see sales that have plummeted and inventories at almost exactly the same level. Awfully bearish for expectations of production growth going forward.


Source: Census

Euro Region GDP Down 1.5%

Bloomberg reports:

Europe’s economy contracted the most in at least 13 years in the fourth quarter, compounding pressure on the European Central Bank to reduce interest rates to the lowest ever next month.

Gross domestic product in the euro region declined 1.5 percent from the previous three months, the European Union’s statistics office in Luxembourg said today. That was more than the 1.3 percent economists expected and the most since euro-area GDP records began in 1995. From a year earlier, GDP fell 1.2 percent in the fourth quarter, the only full-year drop on record.


Source: Eurostat

European Industrial Production (December)

Bloomberg reports:

European industrial production dropped the most on record in December, pointing to a deepening economic slump in the fourth quarter. Output in the euro region fell 12 percent from the year- earlier month after an 8.4 percent decline in November, the European Union’s statistics office in Luxembourg said today.


Source: Eurostat

Thursday, February 12, 2009

Moody's: The United States is Resilient... Not Resistant to Downturn

Felix at Portfolio.com asks the worrisome question:

Can the yield on US Treasuries be considered the "risk free rate of return" if there are other securities which are lower-risk than US Treasuries?
Apparently Moody's has broken up their AAA rating into three tiers and the United States is not in the top tier (though I am left wondering who trusts / listens to / respects / cares about Moody's these days). Reuters reports:
The "Resistant" category included Germany, France, Canada and the four Scandinavian countries, whose ratings have so far been untested. These countries have either entered the financial crisis from a very strong position or have economic models that remain robust, it said.

The "Resilient" group comprises the United States and the UK, whose ratings are being tested due to a shock to their growth model and large contingent liabilities. But it added: "These countries display an adequate reaction capacity to rise to the challenge."

The size of the U.S. and UK economies, financial markets and capital flows and relative debt levels to growth mean policymakers have more scope to loosen fiscal policy without endangering the public finances too much.

Ireland and Spain fell into the third, "Vulnerable" group, which refers to nations which are forced to take risks with their public finances.
Click for Larger Table


Anyone ready for a conspiracy theory? Drumroll please.... this announcement by Moody's comes on the same day as Dr. Greenspan's panning of rating agencies. The Big Picture quotes Dr. Greenspan as saying:
“What we have created in this world is an aura around the credit rating agencies about certification from them is the Good Housekeeping seal of approval, ” Mr. Greenspan said. “I will tell you the record of a lot of the forecasters of ratings have not been distinguished. They never were.”
Was this whole announcement just meant to deflect away Dr. Greenspan's criticism? I doubt it, but I bet more discussion centers around the Moody's rating decision than Dr. Greenspan's quote in the A.M.

Bailout of Securitization Market = Bailout of Banks

Eight top financial executives from various firms appeared yesterday before Congress. CNN reports:

Many of the CEOs at Wednesday's hearing defended their actions, noting that while credit standards have tightened, they were continuing to issue loans. Several of the CEOs added that without government assistance, credit would be even harder to obtain.

"We are still lending, and we are lending far more because of the TARP program," Bank of America Chairman and CEO Ken Lewis said in a copy of his prepared remarks.
Looking at the data, it looks like they may have a point (though they play a big part in this story later on). Since 1948, the commercial banking sector's share of consumer loan holdings dwindled from a peak of more than half the entire market (in the late 1970's), to less than 30% at the beginning of this decade.


The issue thus isn't only whether commercial banks are lending, but how to bring the securitization market back to life. Securitization holdings of consumer loans grew larger than that of commercial banks, all from nothing just 20 years ago.


And now the securitization market has all but ceased. WSJ's Marketbeat reports:
Securitization issuance is down 91% from this point last year, according to Dealogic, with asset-backed issuance declining to $2.6 billion from $32.1 billion at this point a year ago. Most consumer loans, such as credit cards, auto loans, student loans and others, are relatively easy to bundle and sell as securitized assets, but not now, when buyers of such product do not exist.
To summarize the problems in the securitization market (very high-level):

A) Nobody will buy securitized loans (which would restart the market) unless the yields are higher than that reported on bank balance sheets (although they do actually trade at these higher yields)
B) If these high yields were accepted as actual market prices (and not "forced selling" prices), it would force banks to write-down the value of their assets to the point where they could no longer pretend to be solvent

So.... solving problem A means banks are bankrupt (I am not opposed to nationalization, but "the forces" of corrupt politicians and their rich cronies sure are), while solving problem B means we are stuck in the present situation. Thus, without government intervention there appears to be no solution that solve BOTH A and B. This is where the TALF comes in. For details lets go to Morningstar:

Under the TALF, the Federal Reserve Bank of New York will lend to each borrower an amount equal to the value of the pledged ABS minus a haircut. The Fed posted a haircut schedule Friday.

Borrowers will be able to choose either a fixed or floating interest rate on TALF loans. The fixed interest rate will be 100 basis points over the three-year Libor swap rate, and the floating interest rate will be 100 basis points over one-month Libor.

In other words, the TALF will provide cheap, long-term financing, with no recourse to institutional investors, who can use this cheap financing to lever up the below market yields to an attractive level, all the while banks can continue to pretend they are solvent... what a beautiful plan. For everyone except taxpayers that is (who do you think is actually financing this leverage?)

Source: Federal Reserve

Retails Sales Bounce 1% MoM, Down 10% YoY

Marketwatch reports:

U.S. retailers rang up their largest increase in sales in more than a year in January, rebounding strongly after six straight months of sharp declines, the Commerce Department reported. Retail sales increased 1% on a seasonally adjusted basis in January, the first increase since June and the largest percentage increase since November 2007. The gain was unexpected, with economists surveyed by MarketWatch looking for a decline of 0.4%.


Retail sales are down 9.7% in the past year. The government data showed most retail sectors enjoyed increased sales in January compared with December.


Source: Census

Treasury Budget Soars

Xinhuanet reports:

The U.S. federal budget deficit soared to 569 billion dollars in the first four months of the current fiscal year, the highest on record for this period, the Treasury Department reported on Wednesday.
Rolling back that same fourth month time frame back to the mid-1980's we see just how unprecedented this truly is.


Not a surprising result in an economy in which production / employment (thus taxes) are sharply down, while stimulus / bailouts are sharply up. Looking at the 12 month change in the level of receipts and outlays over that same period, we get the following chart which must make all Keynesian's proud and conservatives shudder.


Source: Treasury

Wednesday, February 11, 2009

Real Treasury Yields Moving Lower

Even with the Treasury sell-off witnessed over the past few weeks, with expectations for inflation on the rise, real yields of Treasury bonds (as computed by taking the nominal Treasury rate and subtracting the implied inflation rate embedded in an inflation swap) have been declining at a rapid rate.


(Note that I didn't just graph TIPS real rates as TIPS are trading cheap due to technical / liquidity issues). What does this all mean?

  • The Good: The U.S. Government is borrowing on the cheap (and needs to borrow a lot so cheap = good)
  • The Bad: Real rates are the lowest they have been since Lehman went under... signifying continued stress in markets if investors are willing to take 0.50% real returns over the next 5 AND 10 years

U.S. Trade in Goods Crashing = Contraction of Trade Deficit

Marketwatch reports:

The U.S. trade balance fell to a six-year low in December as the global market for U.S.-made goods shrank at a record pace while Americans also decreased their appetite for imports, the Commerce Department reported Wednesday. The trade gap - the difference between imports and exports of goods and services - fell to a seasonally adjusted $39.9 billion in December, the lowest in nearly six years, from a revised $41.6 billion in November.

The huge change was due to the trading of goods (services held up well, which makes you wonder how bad things would be in the U.S. had we not shifted so dramatically towards a service based economy over the past few decades).

Taking a closer look at both exports and imports of goods, we see a huge drop in both. Important for the trade balance, imports are falling faster than exports AND are falling from a higher denominator (i.e. the reason the U.S. trade deficit is contracting sharply).


Source: Census

Wholesale Inventories Rising Dramatically

In response to my post on Wholesale Sales, GreenAB asks:

Do you have a chart of this data (industry sales ratio)? Vehicle inventories rose 1.7 percent, after increasing 1.5 percent the prior month, while auto sales fell 8.1 percent, today’s report showed. That pushed the industry’s inventory-to-sales ratio up to a record 2.31 months...
You want it? You got it...


Bloomberg further details:
Wholesalers had enough goods on hand to last 1.27 months at the current sales pace, the highest level since 2002. Sliding demand in the U.S. and abroad signals a further pullback in production as companies try to work through their stocks of unsold goods at warehouses, worsening the recession.
More interesting (to me) is the year over year change in the inventory sales ratio.


In other words, even if final consumer demand picks up, wholesalers won't necessarily be buying from producers as they already have the inventory piling up.

Source: Census

Yen Shopping Spree Finally Here?

A strong currency has crushed the Japanese trade balance in recent months.


While the strong Yen makes Japanese businesses uncompetitive (Japan is an export based economy), there are benefits of having a strong currency. Back in October I pondered whether there would be a Yen Based Acquisition Spree on the Way? It looks like it may be. Bloomberg reports:

“A lot of assets have gotten extremely cheap and Japanese investors are looking to park their money somewhere,” said Kenichiro Ikezawa, who oversees about $3 billion as a fund manager at the second-largest brokerage in Tokyo. “Emerging markets including Brazil, Mexico and Turkey look attractive. We would like to invest more in such countries.”

After a year when the yen rallied against 177 currencies, Japan’s biggest money managers say the best is over in the foreign exchange market. The nation’s investors bought 940 billion yen ($10.3 billion) more international stocks and bonds than they sold in the five days to Jan. 31, the seventh week of net purchases, according to the Ministry of Finance.

Japanese companies are also taking advantage of the strengthening currency, spending record amounts on mergers and acquisitions outside the country. The total value of overseas takeovers more than tripled to $76.8 billion last year, according to data compiled by Bloomberg.

Tuesday, February 10, 2009

Great Depression II = Rock n' Roll

I'm going to pretend that machinery = guns so that we can get the trifecta of Guns, Drugs, and Booze as the only things people are buying (besides food). I'm not sure if I'm scared or excited by this...


Source: Census

Revolving Credit Free Fall

Inside ARM reports (bold mine):

With banks freezing credit lines and the economy tanking, consumer credit in the U.S. declined in December 3.1 percent for the third straight month. It’s the longest slide in consumer since 1991.

The Federal Reserve reported late Friday that overall consumer credit outstanding in the U.S. dropped by $6.6 billion in December, or at an annualized rate of 3.1 percent. The Fed’s consumer credit report, called the G.19, does not include debt backed by real estate.

Most of the decline was in revolving credit, most commonly comprised of credit card debt. Revolving credit fell $6.32 billion, or 7.8 percent annualized (5.3% annualized over the quarter), to a total of $963.55 billion outstanding in December. In November, revolving credit declined 8.5 percent.


Source: Federal Reserve

LIBOR Has Come a LONG Way

Some good news!


LIBOR was actually worse than this, but October 17 was the first day Across the Curve presented the LIBOR curve.

Source: Across the Curve

The Case for Nationalization?

The NY Times reports Geithner's plan prevailed. As Mish comments:

Notice how insane this is. The market cap of Citigroup(C), JP Morgan Chase(JPM), and Bank of America (BAC) combined is $158 billion, yet the program is going to provide an initial $250 billion to $500 billion (with more insanity coming) just to deal with "soured mortgage-related assets".


I'll add in Wells Fargo (WFC) to make his point even more clear. In addition, it is important to note that the equity only has this value based on the assumption they were going to be bailed out.

Equity Markets: Expect Volatility

The chart below details the four week rolling change in the value of the DJIA during the Great Depression, against the index itself. Notice all the periods in which the market had monthly returns of 10-20% all the while declining from almost 400 to 50.


In other words, if you feel there is still significant deterioration that will take place in the economy (I do), be very careful at interpreting these 10-20% rallies OR (to be my own devil's advocate), there will be plenty of short-term opportunities to buy equities regardless of your expectations for the economy...

Monday, February 9, 2009

A-Rod: "It was Such a Loosey-Goosey Era"

MLB reports:

Rodriguez told veteran baseball reporter Peter Gammons that he used steroids "for a period of time" and only when he was with the Rangers. Rodriguez played for Texas from 2001-03 before being traded to the Yankees prior to the '04 season.
Don't get me wrong, he is still putting up massive numbers, but not like he did during the 01-03 seasons (though it makes you question what substances he is taking now).


I can't believe I am saying this, but I almost feel bad for Yankees fans. It must be tough hating your own team.

S&P 500 on a Five Month Rally? Just Ignore the First Half of Each Month

Equity markets continue to act wildly different in the first half of each month than the second. As I detailed back in December, this is in part due to rebalancing of large pension plans back to equities towards month-end (as markets have sold off, allocations to equities have become smaller than policy, thus they rebalance from better performing assets).

Going back to September, we see five consecutive months where this has been the case (by more than 5% in each instance).


If an individual had invested in the S&P only during the second half of these months, they would have actually had a positive return (almost 10%) during one of the S&P's worst performing periods EVER.

TARP Review: Taxpayers Paid too Much

The Congressional Oversight Panel (hat tip Felix) reports the Treasury "overpaid" for assets from troubled banks in the first round of TARP; especially when compared to investments made from private investors:

The Panel’s review of the ten largest TARP investments the Treasury made during 2008 raises substantial doubts about whether the government received assets comparable to its expenditures.


It doesn't surprise me that TARP paid above market value for assets (intentionally overpaying made it a form of equity injection - I thought this wasn't a bad thing at the time, though what banks have done with that equity has made me rethink that view). As Yves at Naked Capitalism stated back in September:
The intent is to overpay relative to current market prices, and with real estate and the economy headed south, these assets are certain to trade at even lower prices for a very long time. Plus banks will sell the stuff where they think Treasury is overpaying the most, and hang on to those assets that they think have the most upside.
That being said, I completely agree with Felix on his comment that:
If Treasury wants to overpay for bad assets, in order to recapitalize the banking system, then it should do so transparently. What's unforgivable is lying, and saying that you're paying a fair price when you're not.

Same Store Sales (January)

Missed this last week. CNN Money reported:

Most U.S. retailers, including Gap Inc., Target Corp. and Macy's Inc., reported weak January same-store sales Thursday as soaring unemployment and the deepest recession in three decades led consumers to retrench even as Walmart Stores Inc. bounced back with a gain for the month.


So to increase market share in this environment, all you have to do is be Walmart or take advantage of teens that can no longer afford Abercrombie and Fitch which is refusing to discount merchandise:
"We really feel that parents and teens are voting with their dollars," Chen said. "Competitively, at full retail price points, Abercrombie is too expensive. If Abercrombie chooses not to promote, that could continue to help the other retailers."
Is this a new data point to look out for? When / if Abercrombie discounts will that be the contrarian sign we've finally hit bottom?

Friday, February 6, 2009

EconomPics of the Week (2/6/09)

Unemployment
Unemployment to 7.6%: Broader Unemployment to 13.9%.
And the Best Reason to Stay in School is...
Unemployment: Birth Death Adjustment at it Again
Global Unemployment

Economic Data
German Production Down Most Since 1960's
Productivity and Costs: The Tale of Two Cities
ISM Services (January)
ISM Manufacturing Improves
Personal Consumption Down... No More "Borrowing"
European Labor Productivity
Disposable Income Breakdown

Assets
Vacant Homes "Cliff Climbing"
Top 20 Auto Brands: Then and Now
January Auto Sales... 45 Year Low
Pending Home Sales... Foreclosure Boom
Hedge Fund Returns (January)

Other
Deflation Worries Easing?
Game Theory: Why Giving the "Option" to Limit Pay Won’t Work

German Production Down Most Since 1960's

Not even when the Berlin Wall fell and Germany had to deal with the combination of East and West Germany has production fallen this fast. Per Bloomberg:

Industrial production in Germany, Europe’s largest economy, dropped the most in at least 18 years in December as demand for plant and machinery faltered.

Output fell a seasonally adjusted 4.6 percent from November, the biggest decline since records for a reunified Germany began in January 1991, the Economy Ministry in Berlin said today. It was the fourth straight monthly drop and almost twice the 2.5 percent retreat forecast by economists in a Bloomberg survey.

And the Best Reason to Stay in School is...


And those unemployed are having a difficult time re-entering the work force.

Unemployment: Birth Death Adjustment at it Again

YET AGAIN... the Birth Death Model overstates employment. Per The Big Picture:

Since 2003, the B/D adjustment has been part and parcel to BLS' Current Employment Statistics (CES) program, the official measure of US employment. In brief, the Birth Death adjustment imagines (hypothesizes) how many jobs were created by companies too new and/or too small to participate or be found by CES. The model attempts to create what is perceived as a BLS error at the start of any recovery, when many new jobs are created but missed by BLS.
The birth death model did subtract 356,000 jobs in January (though LESS THAN the 378,000 reduced in January 2008; January and July are typical revision months). In addition, hidden from the January revision was an additional -180k revision for the April - December 2008 time frame as follows:


Rather than put those revisions in the prior months, I lumped the revisions into January to update the NFP / Birth-Death chart below:


As can be seen above, even with the revisions, the Birth / Death Model still indicates 746,000 net new jobs were added by small businesses in the past 12 months (while more than 3 million jobs were shed), including 12,000 in finance!


In other words, the unemployment figure was ugly, but it likely is even worse.

Source: BLS

Unemployment to 7.6%:Broader Unemployment to 13.9%


Source: BLS

Thursday, February 5, 2009

Hedge Fund Returns (January)

These returns compare very well to the -8.4% return in January for the S&P 500.


Note that I removed the Equity Short Bias Index from the above chart (as of yesterday it had only 1 data point and was down 9% which looked funny considering equities sold off).

Source: Barclay

Productivity and Costs: The Tale of Two Cities

Businesses: Production per hour up. Hours down. Total Production modestly down.


Durable Goods Manufacturing: Cliff dive (my guess with compensation is they have laid off the "cheap" workers and kept middle management)


Source: BLS

Deflation Worries Easing?

Paul Krugman posts a chart that he believes shows a strong relationship between an output gap and deflation, while Paul Kedrosky implies that same chart shows randomness. So which is it... inflation or deflation?


CPI swap expectations have moved from north of 3% as recently as last May to negative (i.e. expected deflation over 2 and 5 years). Since mid-December, they are all beginning to reverse course. In other words, the market can't figure it out either.

Wednesday, February 4, 2009

Vacant Homes "Cliff Climbing"

Marketwatch reports:

The vacancy rate for homes typically occupied by the owner rose to 2.9% in the fourth quarter of 2008 from 2.8%, matching the all-time high set a year ago, the commerce Department reported Tuesday. Prior to the housing bubble bursting in 2005, the vacancy rate had never been above 2%. For rental properties, the vacancy rate rose to 10.1% from 9.9%. The homeownership rate fell to 67.5%, the lowest since 2001. In the fourth quarter, 2.2 million homes were vacant and for sale, virtually unchanged from a year earlier. The nation's housing stock increased by 2.2 million in 2008 to 130.8 million.


It had been thought that the problems in the "owner occupied" segment of the housing market would be a boost to the rental market (i.e. those that can no longer afford to own) and it has by number. The problem for those that own those rental homes is there is absolutely no pricing power due to the huge growth in vacancies.

And before the comments begin stating this chart is distorted because the number of vacancies is still substantially smaller than owner occupied units... save it. Since 2004, the number of vacant homes has increased by 4.65mm units or roughly 400,000 more than the increase in those owner occupied.

Source: Census

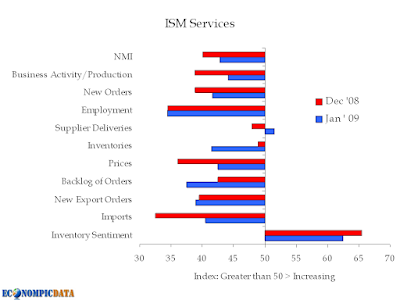
ISM Services (January)

Continued deterioration, but at a slow rate (note that Inventory Sentiment above 50 means respondents believe inventory levels are too high).


Source: ISM

Game Theory: Why Giving the "Option" to Limit Pay Won't Work

The AP reports:

The Obama administration plans to limit pay to $500,000 a year for executives of government-assisted financial institutions in a new get-tough approach to bankers and Wall Street, a senior administration official said Tuesday.
Back in September I used the below chart to show why giving banks the option to accepting TARP money with the caveat that they must limit pay will fail (they key is the option). My guess... if this passes, many banks will simply give the bailout money back (hey, maybe that's what the Whitehouse is hoping for).

Originally posted September 26th, 2008:

Lets assume for the time being that there are only two banks; Bank A and Bank B.

The media / political pundits would have you believe the likely outcome of the bailout is the top-left box in which both Bank A and B sell risk assets to the Treasury. In this case, the result is a more regulated banking industry, with imposed limits to salary, but importantly markets clear.

Click for larger table:


HOWEVER, it is in BOTH banks interest to deviate from that.

Why? Simple. If Bank A (or B) believe the other is selling their risk assets to the Treasury; they will each be better off holding on to theirs.

Why? If the other bank sells and they hold, markets will still clear (in theory) and the bank that holds onto their risk assets can sell at the new market prices. This results in increased market share as they:
  • Can pay more for talent
  • Are less regulated
  • Don’t have the stigma of selling to the Treasury (think of what selling portrays to the market)
This is even worse in the “real world” as all banks have the incentive to wait for other banks to sell risk assets to the Treasury to clear markets.

The likely result? The bottom right box in which no bank sells voluntarily and markets remain frozen. While there were many problems with the initial plan, at least there was a 100% incentive to sell the assets.

Top 20 Auto Brands: Then and Now

Yesterday we took a look at the year over year change in sales across all brands in terms of percent, today we'll take a look at the top 20 brands by units sold. Unbelievably, Kia sold more units than Pontiac AND Chrysler combined (last year Kia sold 1/3 of that combined total).


Source: Auto Blog

Tuesday, February 3, 2009

January Auto Sales... 45 Year Low

How low were January sales? According to the FT (hat tip Infectious Greed):

US car sales fell to their lowest level since 1963 in January – and were less than China’s on an annualised basis for the first time – as rental fleets and consumers bought fewer vehicles in spite of steep industry discounts and government efforts to ease lending.
Click for ginormous chart


Hey, it could be worse. According to Auto Blog:

If you think things have been tough for General Motors in America, you should see how bad it's going for them in Japan. Forget pulling out of the Tokyo Motor Show, we're talking a steady sales decline over the past decade that has brought volume to just 2,000 units a year from a high of 50,000 in 1996.
Source: Auto Blog

European Labor Productivity

Absolute Return Partners (via InvestorsInsight) dives into a topic I asked for reader help (and received a bunch of great comments) not too long ago... can the Euro survive? While the article goes into much greater detail about why the European Union is /isn't in trouble, the below portion details how a single currency removes the option for the "PIGS" (Portugal, Italy, Greece, and Spain) to devalue their currency to remain productive:


Since the introduction of the euro, the PIGS have failed miserably to keep up with Germany on this measure of competitiveness. So has Ireland by the way, hence its current predicament.
EU countries outside the euro zone, such as the UK, have also lost out to Germany in recent years, but the UK has been able to play a card which is not at the disposal of the euro zone members. That card is called devaluation. Whether by design or otherwise, the UK has received a massive boost to its competitiveness in recent months as a result of the sharp fall in the value of the pound. Italy used to play this card repeatedly back in the days of the Lira. So did countries like Denmark in the dark days of the 1970s.

Pending Home Sales... Foreclosure Boom

The Big Picture reports Foreclosure Sales in the West Drive PHSI

A surge in foreclosure sales and distressed properties was the primary driver behind a notable improvement in the Pending Home Sales Index. In December, the PHSI rose 6.3% from an upwardly revised reading in November. The more important year-over-year reading was a more modest 2.1% increase versus December 2007.


The west bounced back, but as Barry stated:
Given what we know about the foreclosure-driven existing home sales out west, this last data point is no surprise.
Source: realtor.org

Disposable Income Breakdown

A breakdown of those areas contributing to disposable income going back to 1948 is below. Compensation for employees and proprietors income (i.e. salaries) have decreased from well north of 80% to 70%, while personal income receipts on assets increased from less than 10% in 1948 to almost 20% in 2008 (i.e. owners of capital had been king).


And the area with the largest growth over the past 60 years? Personal current transfer receipts, which according to the BEA are:

Payments to persons for which no current services are performed. It consists of payments to individuals and to nonprofit institutions by Federal, state, and local governments and by businesses.
Expect this to grow dramatically in coming years... we're all socialist now!

Source: BEA

Update- an anonymous comment adds:
I think you're ignoring the possibility that much of this is demographic (Social Security and Medicaid). As you say, it will get worse (with the pickup in Boomer retirement).
Good point.