Thursday, March 12, 2009

Budget Cliff Dive (February)

File this under "a day late". The AP reports:

Lower tax revenue and massive government spending on the bank bailout pushed the federal deficit to $765 billion in the first five months of the budget year, well on its way to hitting the Obama administration's projection of a record annual imbalance of $1.75 trillion.

The Treasury Department also said Wednesday that the February deficit reached $192.8 billion. That's a record for the month and up 10 percent from a year ago, but below analysts' expectations of $205.7 billion.

With seven months left in the current budget year, which ends Sept. 30, the deficit already has shattered last year's record annual gap of $454.8 billion.


Source: Treasury

Wednesday, March 11, 2009

EIA Cuts Oil Price Forecast

The EIA reports:

The annual price of West Texas Intermediate (WTI) crude oil averaged $100 per barrel in 2008. The global economic slowdown is projected to cut these prices by more than half, to average $42 per barrel in 2009 and $53 in 2010—forecasts slightly lower than last month’s Outlook.


Source: EIA

You Don't Have to Go Home, But You Can't Stay Here

Note: The annual "quit rate" is the number of quits during the entire year as a percent of annual average employment, while the annual "layoff rate" is the number of layoffs and discharges during the entire year as a percent of annual average employment.

First. lets take a look at the quit rate by industry. For anyone who ever worked in the food services business (me) it isn't a surprise that leads the way, while those in the durable goods industry rarely leave (they tend to be paid quite well as compared to other opportunities of their education attainment) and stay put.


The change in the quit rate since 2006 is where things get more interesting. Outside of mining and logging, all other industries have seen the quit rate drop, and in some cases significantly (who is quitting in this environment?). Apparently those who have jobs in the information industry have extra reason to stay put.


Part of the drop in the quit rate can be explained by those laid off (if you get laid off, you can't quit). Below shows the increase in the layoff rate by industry since 2006. Construction leads the way, but mining and logging shows up #4, while it was the #1 area in which individuals quit (commodity bubble anyone?).


Unlike what we saw in mining and logging, in most instances we quitting and laying off workers has a negative correlation, but the fact that people are still more likely to quit as be laid off makes me somehow proud that even in this economic mess, we are still all self-serving capitalists...


Source: BLS

LIBOR on the Rise...

The Financial Ninja details the recent increase (far from a spike) in LIBOR:

Remember our good friend LIBOR? Well, he's totally causing shit again. So don't get too excited about this short squeeze... errr... rally. (You don't put in THE bottom with a spike in Libor.)

Three-Month Libor for Dollars Increases for 11th Day: "The cost of borrowing in dollars for three months in London rose for an 11th day as banks sought cash to cover their commitments through the end of the first quarter.

The London interbank offered rate, or Libor, that banks say they charge each other for such loans climbed two basis points to 1.33 percent, the highest level since Jan. 8, the British Bankers’ Association said. The Libor-OIS spread, a gauge of bank reluctance to lend, increased to the most since Jan. 9.

NASDAQ Soars to Levels Not Seen Since.... Last Wednesday

While the NASDAQ returned a whopping 7.1% yesterday (and I hope yesterday is something "we can build on"), I warn all investors not to get too far ahead of themselves. As the title above and chart below details, the closing value of the NASDAQ returned it to a level last seen just 4 days previous.


In addition, yesterday's return doesn't necessarily suggest much going forward. Historically, large up days (or large down days) haven't been correlated to one-month forward returns. That said, I personally expect a pretty sharp "sucker's rally" (i.e. a jump of 20%+, before it runs out of steam to new lows) at some point in the near future.


The key question I'm asking myself... is this it?

Source: Finance

Tuesday, March 10, 2009

Gold... Has It Really Stored Value?

In response to yesterday's inflation adjusted S&P 500, we were asked:

Could you present the same plot but with inflation-adjusted gold overlayed on the data? It would be interesting to see if stocks really do outperform over the long-term...
Over the past 34 years, the price of gold is only 25% higher in real terms.


Compare this to yesterday's chart to equities... (note this is back one more year than the chart for gold... I can't dig up that last year of gold data), which shows equities returned 400% in real terms over the past 35 years.


And the following chart combining the two 10-year rolling periods...


Surprised?

You shouldn't be... asset inflation (whether via gold, housing, or commodities) serves no long-term productive purposes... only increased productivity creates actual economic value. Thus, the movement of capital towards productive resources (i.e. what equities, fixed income, and bank loans are intended to do) is the only type of long-term investment that really creates broad economic value.

Using an extreme example: Imagine if all the wealth in the world simply went to buy assets (to be more extreme, lets pretend it all went to gold and was in turn stored in a vault). There literally would be no global economy.

Long Booze and Drugs / Short Oil and Autos...

We already looked at Wholesale Sales month over month, here's year over year.

Wholesale Sales: Durable Goods Down... Nondurable Up

Bloomberg reports:

Sales at U.S. wholesalers fell four times faster than inventories in January, indicating businesses will pare orders further in coming months. Sales slumped 2.9 percent to $326.1 billion, the lowest level in more than three years, the Commerce Department said today in Washington. The 0.7 percent decrease in the value of stockpiles followed a revised 1.5 percent decrease in the prior month. It was the fifth straight monthly drop, the longest such stretch in almost seven years.


Source: Census

"Cash Rules Everything Around Me"

Business Week details:

At a time when the economy is experiencing its steepest drop-off since the depths of the 1982 recession, it's perhaps not surprising that cash is the new black at big corporations—and the bigger the pile, the better. With that in mind, BusinessWeek sought out 21 U.S. outfits that most aggressively stockpiled cash in the most recent quarter. Collectively, this group of companies added $83.7 billion to their balance sheets. By contrast, they reduced their cash by a total of $808 million during the same quarter of 2007.

Financials: Here We Go Again Edition

As the WSJ details:

In a way, the recent deterioration in corporate credit spreads and other lending indicators shows that the Federal Reserve can only do so much. The Fed has had success with its introduction of various programs to stabilize credit markets — but the generalized anxiety investors feel about the economic landscape has not been altered, and of late, it has worsened.

Credit spreads, on the whole, have worsened of late, widening against government-issued bonds, and credit-default swap spread levels have also widened, particularly for financial issues. But it’s important to note that this recent deterioration reflects worries about the economy rather than a fear-driven flight from risky assets due to liquidity concerns, as it did in the fall.

Monday, March 9, 2009

Box Office Continues Hot Streak

The box office continued its hot streak. Box Office Guru reports:

The adult-themed superhero film Watchmen seized control of the North American box office posting the biggest debut of the year with an estimated $55.7M in ticket sales over the Friday-to-Sunday period. Directed by Zack Snyder (300, Dawn of the Dead), the R-rated film based on the acclaimed 1986 comic series averaged a muscular $15,413 from 3,611 theaters. It was the third best March opening ever trailing 300 ($70.9M) and Ice Age: The Meltdown ($68M) and the sixth largest bow for an R-rated film after The Matrix Reloaded ($91.8M), The Passion of the Christ ($83.8M), 300, Hannibal ($58M), and Sex and the City ($57M).

Inflation Adjusted w/ Dividend S&P 500

The Big Picture posted a chart from Crossing WallStreet showing the inflation adjusted Dow. Mike asks:

Anyone know what it is with dividends?
Not the Dow, but detailed below are returns of the S&P 500 with dividends going back to 1973, both cumulatively and by 10-year rolling average.

Cumulative


10-Year Rolling Period


Not pretty, but 1996 is not as bad as The Big Picture's title “Inflation Adjusted Dow is at 1966 Levels” might imply.

Source: BLS

Global Stimulus as a Percent of GDP

The IMF details:

Many countries have announced plans to implement a sizeable discretionary fiscal stimulus to boost aggregate demand. To date, the G-20 countries have adopted (or plan to adopt) fiscal stimulus measures amounting on average to around ½ percent of GDP in 2008, 1½ percent of GDP in 2009, and about 1¼ percent of GDP in 2010. For 2010, however, most G-20 countries have not yet announced fiscal packages, so the current estimate should be viewed as tentative.

Friday, March 6, 2009

EconomPic Turns One... Pics of the Week

Last March 4th, EconomPic came to be with this sorry looking chart of the CPI. The point of the blog was simply to store charts that I have been creating to get a better sense of what made up headline economic figures you see in the news.

Here and there, I would send Barry over at The Big Picture (I used to correspond with Barry from my business school days) some of these charts, which on occasion he would post and to my amazement I would get a few hundred hits from his site.

I didn't post a single word on EconomPic until June 11th of last year when I wrote a post titled "Why Not Deflation?". I honestly didn't expect a single person to read the post, but wanted strictly to document this belief so I could prove to a friend or two that I had called it right when the economy slowed. Likely due to my own click through to Naked Capitalism (I linked to a post at Naked Capitalism, which likely made Yves aware that my blog even existed), to my utter amazement, it was made one of her links of the day.

The rest so they say is history. In my close to 900 posts, I've learned more about the economy and world of finance than I thought possible (yet I still know nothing). This is only possible by the great reader base and other great bloggers I read daily that have made traditional media seem flat and out of touch. The thought of giving back to this community provides the motivation to keep making ~20 posts per week, even though my real job already takes up too much of my time (though there is plenty of overlap, ALL the work I detail here is mine) and includes a travel schedule anyone would despise.

The ability to share my thoughts with such a wide base of readers (1,000,000+ page views and right around 850 current subscribers through Google Reader) is humbling. While I would love to share more about myself, my "other life" in the investment world makes this next to impossible without risking the ability to continue posting.

Thanks to everyone who has read or contributed, which has enabled EconomPic to be something more than a storage space for these tacky charts.

-Jake


Asset Class Performance
Market Bottom or Bomb Shelter Stage?
"Rational Apathy"
Backlog Orders up 72%... Name That Company
Hedge Fund "Out" Performance (February)
Is GE an Industrial or Financial Firm?
Box Office = Recession Special
Warren Buffett... Human After All?

Economic Data
The Death of the Teenage Workers
Positive News Alert! Consumer Credit Rebound
Unemployment by Education Attainment
Unemployment 8.1%; Broader Unemployment to 14.8%
Pending Home Sales (January)
Productivity Down; Costs Up
ISM Services (February)
Wholesale Shipments: Booze and Cigarettes
http://econompicdata.blogspot.com/2009/03/ism-manufacturing-unlucky-13.html
Rebound on the Way... I Mean It... Any Year Now......
Personal Savings Bounce
GDP = C + I + G + NE

Budget / Armageddon
How Big is the Budget: Part I
How Big is the Budget: Part II
Country Vulnerability Rank and Debt to GDP
IRA's Bank Stress Tests
Auto Sales: And Boom Goes the Dynamite
Tic... Tic... Tic...

The Death of the Teenage Worker

Apparently the teenage worker is disinterested and unwanted...


Source: BLS

Positive News Alert! Consumer Credit Rebound

I'll take whatever "non-bad" news I can get...


Source: Federal Reserve

Backlog Orders up 72%... Name That Company

Armageddon trade of the day... Sturm, Ruger & Company, Inc:

Designs, manufactures, and sells firearms in the United States. The company offers its products under ‘Ruger’ name in four product categories, including single-shot, autoloading, bolt-action, and lever action rifles; over and under, and side by side shotguns; rimfire autoloading and centerfire autoloading pistols; and single action and double action revolvers.
It also happens to be the only stock in the S&P 500 (according to a comment this morning on CNBC) reaching a new intra-year high today.


HoweStreet details:
Its revenues and earnings are increasing, and the company's backlog in orders jumped 72 percent from the 3rd quarter to the 4th quarter.

Why is the outlook improving for gun manufacturers?

Maybe because while other industries are sliding down a slippery slope of lower demand, the output of U.S. small arms manufacturing is forecast to grow at an annual compounded rate of 2 percent between 2008 and 2013.

The sales of both guns and ammo are flying partly due to worries about economic calamity and partly because the National Rifle Association is fanning the flames of rumors that President Obama wants to confiscate guns and raise ammunition taxes by 500 percent.

Will President Obama tighten the rules on gun sales? I have my doubts. With the economy collapsing, he has bigger fish to fry. Nonetheless, if history is any guide, the NRA will constantly ring the alarm bell for the next four or eight years ... and gun manufacturers will reap the benefits.

Unemployment by Education Attainment


Source: BLS

Unemployment 8.1%; Broader Unemployment to 14.8%


Source: BLS

Country Vulnerability Rank and Debt to GDP

Niels Jensen, head of Absolute Return Partners, details in Europe on the Ropes:

To make matters worse, the problems in the East are beginning to look systemic. Credit Suisse has produced an interesting scorecard where they rank a number of countries around the world on factors usually taken into consideration when assessing the credit quality of sovereign debt. At the top of the tree (i.e. the worst credit score) you find Iceland – hardly surprising considering their current predicament. More importantly though, of the next 14 countries on the list, 8 are Eastern European – not what you want to hear if you are an already undercapitalised European bank with huge exposure to Eastern Europe.


Source: Investor Insights

Thursday, March 5, 2009

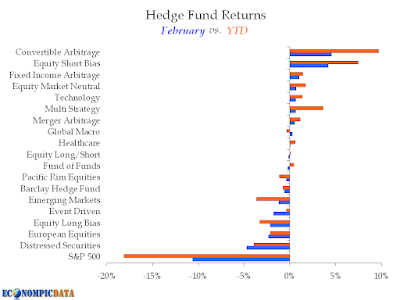
Hedge Fund "Out" Performance (February)

Don't look now, but hedge funds are GREATLY outperforming the equity market.


Source: The Barclay Group

IRA's Bank Stress Tests

Chris Whalen (via The Big Picture) details his firm's (Institutional Risk Analytics) latest bank stress test results:

Notice the way in which the banking industry has shifted from a skew in favor of “A+” rated bank units at the start of 2006 – those with stress levels below the 1995 benchmark in the Stress Index – to a situation today where the number of “A+” rated banks has been cut in half and over 2,000 bank units now are rated “F”.

Being rated “D” or “F” does not mean that the institution will fail, but it does mean that the bank’ current performance in Q4 2008 was far above the industry’s elevated stress levels and thus the bank get’s a poor grade for this period. Indeed, in many cases institutions with relatively high levels of stress could be excellent value for investors.


As of the fourth quarter, IRA had JP Morgan, Wells Fargo, and Bank of America all at an A rating, while Citi was a resounding F. I wonder what kind of rating Bank of America has these days post-Merril acquisition...

Source: Institutional Risk Analytics

Wholesale Shipments: Booze and Cigarettes

Census details:

Shipments of manufactured durable goods in January, down six consecutive months, decreased $7.5 billion or 4.0 percent to $182.4 billion, revised from the previously published 3.7 percent decrease. This also was the longest streak of consecutive monthly decreases since the series was first published on a NAICS basis in 1992 and followed a 1.5 percent December decrease.

Shipments of manufactured nondurable goods, up following five consecutive monthly decreases, increased $1.0 billion or 0.5 percent to $187.0 billion. This followed a 5.1 percent December decrease. This increase was due to petroleum and coal products, which increased $2.7 billion or 9.4 percent to $32.0 billion.


Source: Census

Productivity Down; Costs Up

Bloomberg reports:

U.S. worker productivity in the fourth quarter unexpectedly fell as the economy shrank even faster than companies cut jobs and hours.

Productivity, a measure of employee output per hour, fell at a 0.4 percent annual rate, the first decrease in a year and much less than the 3.2 percent gain estimated last month, the Labor Department said today in Washington. Labor costs climbed 5.7 percent, more than prior projections.

The figures, coming a day before the government’s employment report, indicate companies will keep cutting jobs to contain escalating losses. Deteriorating labor and housing markets will sap consumer spending further, magnifying the risk this recession may turn out to be the worst in the postwar era.


Source: BLS

Is GE an Industrial or Financial Firm?

I'm going to go out on a limb and say the market identifies GE as a financial firm.


Note: The financial index returns listed are that of ETF XLF

Wednesday, March 4, 2009

ISM Services (February)

Earlier this morning, Marketwatch reported:

U.S. nonmanufacturing sectors contracted at a faster pace in February, according to a Wednesday report from the Institute for Supply Management, as the global slowdown continued to take its toll. The ISM non-manufacturing index fell to 41.6% in February from 42.9% in January as survey respondents' comments reflected concern about financing and general weak economic conditions. Economists polled by MarketWatch were looking for a February result of 41%. Readings below 50% indicate that more firms are contracting than expanding.


Source: ISM

Market Bottom or Bomb Shelter Stage?

Click for larger image


Thanks to reader JackCroww for the recommendation.

Pending Home Sales (January)

Realtor.org spins the slaughter:

Lawrence Yun, NAR chief economist, said the downturn in the economy also weighed heavily on the data. “Even with many serious potential home buyers on the sidelines waiting for passage of the stimulus bill, job losses and weak consumer confidence were a natural drag on home sales,” he said. “We expect similarly soft home sales in the near term, but buyers are expected to respond to much improved affordability conditions and from the $8,000 first-time buyer tax credit.”


Source: Realtor.org

Auto Sales: And Boom Goes the Dynamite

CNN Money reports:

U.S. auto sales plunged 40% in February, the latest sign of trouble for the battered industry.

The weakness was broad-based, with sales of virtually every vehicle offered by the nation's six largest automakers falling at least 10% from year-ago levels.

Sales tracker Autodata estimates that industrywide, cars and light trucks sold at a seasonally adjusted annual rate of 9.1 million vehicles last month. That's the lowest level since December 1981. A year ago, this sales rate was 15.4 million.
Year over Year


While it is important to note that the chart below is not seasonally adjusted, it does show which brands have at least snapped back last months horrendous results and those that continue to slide. Saab is no surprise considering they are up for sale, but what is going on with Cadillac?

Month over Month


Source: Autoblog

Tuesday, March 3, 2009

Rebound on the Way... I Mean It... Any Year Now... And It Will Be HUGE

The Council of Economic Advistors via Whitehouse.gov responds to criticism of their "rosy" projections in the Administration's budget for economic growth:

But, a key fact is that recessions are followed by rebounds. Indeed, if periods of lower-than-normal growth were not followed by periods of higher-than-normal growth, the unemployment rate would never return to normal.

Another key fact is that deeper recessions are typically followed by more rapid growth. Table 2 shows the peak-to-trough decline in real GDP in each of the last 10 recessions, along with the average growth rate (at annual rates) in the 8 quarters following each recession.


Interesting, but...
  • This is like saying "if you survive cancer, you will live a great life"
  • How many of these recessions involve systemic financial meltdowns... none you say?
  • After a recession, the economy is smaller... so OF COURSE the economy will bounce back and appear to grow at a higher rate as it trends back to norm (i.e. if the economy goes down 50%, then rallies 100% it is only back to where it started... extreme, but you get the point)
Update: As reader AJK points out:
I'm assuming there's no +8qtrs for the recession ended in 7/80 because it was only 4 quarters until the next recession. Correct?
You are correct: BEA

Box Office = Recession Special


Source: Box Office Mojo

"Rational Apathy"

The original title was "What the opposite of Irrational Exuberance" (thanks Tahoe):

Floyd Norris reports:

Another stock market milestone was reached last week, when the S.&P. 500 fell under the Dec. 5, 1996, close of 744.38. The Dow, for what it is worth, is still above the 6,437.10 level it sported then.

(As I write this, the S.&P. is at 714 and the Dow at 6,880.)

That night Alan Greenspan uttered his legendary “irrational exuberance” comment. It was actually a question:
”How do we know when irrational exuberance has unduly escalated asset values, which then become subject to unexpected and prolonged contractions as they have in Japan over the past decade?”

Tic... Tic... Tic...

As everyone knows by now, AIG lost $61.7 Billion last quarter. That's $7757 per second...


Reader Nitric Oxide points out:

You stop at 3 tics, if you extend your graph to show a few more tics the effect would be much higher. The scary effect, that is.


Here's 30 second worth... or $233,000.

Source: Dealbook

Monday, March 2, 2009

ISM Manufacturing @ Unlucky 13

Better late than never? Or just too late? (Traveling all week so a lot these economic releases may be delayed).

Today's ISM Manufacturing release shows the index contracted a 13th straight month. There was some optimism stating the second derivative turned positive (i.e. it was better than last month, though still contracting), but it is hard for me to be optimistic off of a sharp contraction from already low figures...


Source: ISM

Personal Savings Bounce


Source: BEA

How Big is the Budget: Part II

While Felix looked at the deficit in terms of past budgets and the budget in terms of per household averages, to properly put it in perspective one must compare it to the earning power of the United States (i.e. GDP). Taking historical budget data from the CBO, comparing it to nominal GDP from the BEA, and assuming no GDP growth in 2009, we get the following chart showing a spike in the budget from its 18-22% range during 1969-2008, to above 25%.


The next chart details the year over year increase in the budget, as a percent of GDP. This year budget will take up a whopping 4.5% more of GDP than it did a year ago.


Source: CBO / BEA

How Big is the Budget: Part I

There is no question that the new budget and deficit is BIG. Felix at his Market Movers blog tries to put the current budget in perspective:

It's pretty much impossible to get one's head around the sheer enormity of the numbers in Barack Obama's first budget. But it's important to try, and one anonymous commenter has a very good point: the entire federal budget, as submitted by President Clinton in 1996 through 1999, was smaller than the budget deficit that Obama is proposing for next year.


While this obviously ignores inflation, it does put the vastness of the budget in perspective. His next comparison brought out a lot of criticism from readers, but I think they miss the point (remember, this is just about putting it all in perspective):
Obama's total budget is $3.6 trillion, which works out at $34,000 per household; median household income is about $50,000. Which basically means that for every dollar that a US household earns, the US government plans to spend 68 cents next year. And the ten-year T-bond still yields less than 3%. Extraordinary.

Criticism was raised that he was comparing a per family average (the budget portion) with a median (rather than average) household income. His point (I believe) is that for the median family out there earning ~$50,000 this year, the government is chipping in an additional $34,000. That my friends, is some government spending!

Sunday, March 1, 2009

GDP = C + I + G + NE


Source: BEA