Showing posts with label household income. Show all posts

Tuesday, September 13, 2011

Real Median Household Incomes at 1996 Levels

The WSJ details:

The income of the average American worker—long the envy of much of the world—has dropped for the third year in a row and is now roughly where it was in 1996, adjusted for inflation.

The U.S. poverty rate, meanwhile, has continued to rise. America's median household income—what the statistical middle of the pack earns in a year—fell 2.3% to $49,445, adjusted for inflation, according to the Census Bureau's annual snapshot of living standards. The figure has fallen each year since 2007 as high unemployment and a tougher job market has made it harder for working Americans to get bigger paychecks.

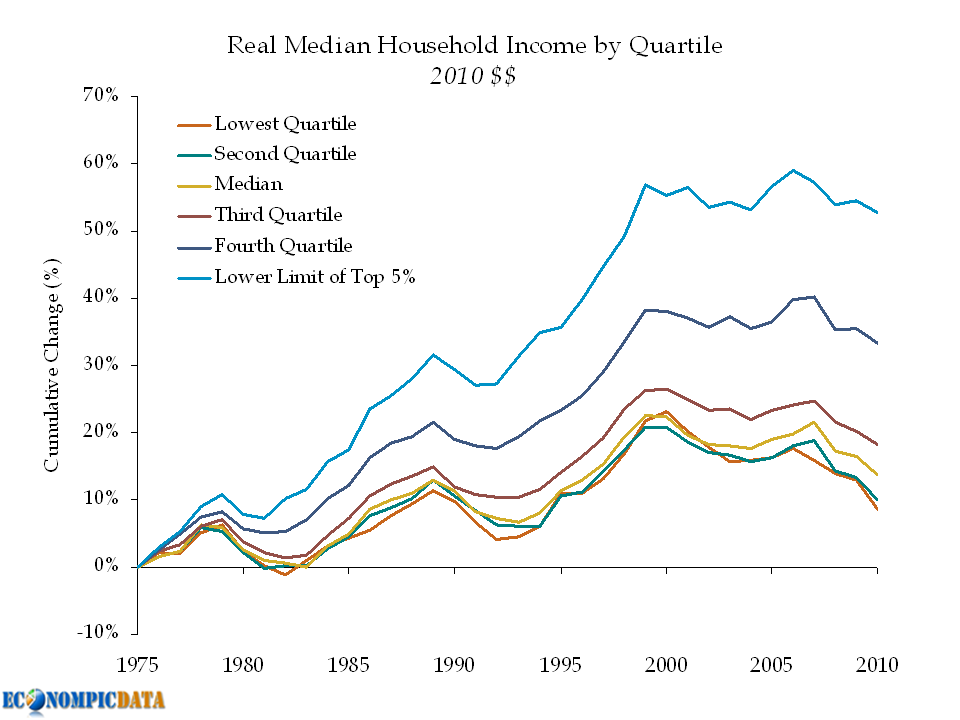
This downdraft is part of a longer trend that has wiped out the wage gains of the last decade. Inflation-adjusted household income is now down 7.1% from its peak in 1999, and 2010 is the first time since 1997 that American households made less than a median of $50,000.

As the chart below shows, even upper incomes have been affected by the sluggish economy.


A large factor driving the have / have nots has to do with education. In the past (i.e. a long time ago), an individual could use either their hands or their minds and make a "livable" salary. As EconomPic has detailed multiple times, education matters and labor intensive jobs are no longer a viable means for most.


The issue has been amplified because individuals didn't act as if incomes were stagnant. Back to the WSJ.
"The past decade was just a mirage," says Justin Wolfers, an economics professor now visiting at Princeton University. That's because wage gains earlier in the decade were never that robust, yet people were able to take advantage of surging housing values and easy credit to spend more than they earned.
Source: Census

Monday, December 7, 2009

Income Disparity

Forbes (hat tip The Reformed Broker) with just how large the income gap has grown in the United States:

We based our list on the U.S. Census Bureau's Gini Index, which ranks income inequality in cities on a scale of 0 to 100. Imagine two islands, each with only five people, and a total income of $100,000. On one island, each person earns $20,000. This island has total income equality, and a Gini score of 0. On the other island, one person earns $100,000 and the other four people earn nothing. This island has total inequality, and a Gini score of 100.

The United States as a whole had a Gini score of 46.9 in 2008. By comparison, incomes are more equal in Europe (the E.U. has a score of 31), and less equal in South America (Brazil has 56.7; Bolivia has 59.2).

For what it's worth, no U.S. city has income equality that's close to the levels of Europe. Only seven of the 250 largest American metro areas have Gini scores below 40.
And the top 10 most unequal cities per Forbes:


The Reformed Broker notes that this trend is likely to reverse in coming years.
Income disparity in America is the one enduring thing George W actually can take credit for. Unfortunately for those on top, Obama's on a mission to tax this disparity back to the Stone Age. The pendulum always swings too far in both directions, this time, it's heading hard left.
Update: an anonymous reader has an issue with The Reformed Brokers semantics:
Obama's on a mission to tax this disparity back to the stone age???

I think what the Reformed Broker (who is clearly an idiot) means is that Obama plans on taxing this disparity back to the levels of 1994-2000... you know, when Clinton was busy destroying the economy and putting the US income inequality at Marxist levels. Moron.
I think the key takeaway is we are likely to see income disparity brought more in line. Whether it is the stone age or 1994-2000 is another question.

And The Reformed Broker responds with typical candor:
I have another fan!

As a centrist on many issues, I am no stranger to being the target of personal attacks from idealogues on both sides.

Thx to "Anonymous"!
Too true. If it were a right wing conservative with the issue, he would have attacked the George Bush rather than the Obama reference... actually, do conservatives even admit they voted for him twice?

Monday, September 21, 2009

Income for the Masses Not Keeping Up... For 40 Years

A few weeks ago I detailed the divergence in household incomes showing the top 5% of earrners gained mightily over the past 40 years relative to lower level incomes. But in comparing all those income brackets to the growth of the broader economy (on a per capita basis), even those top 5% earners' didn't keep up with the pace.


So over the past 40 years, the only individuals that have seen their incomes increase at / or greater than the level of GDP were those earning more than those in the top 5% (think top 1%).

Source: Census

Thursday, September 10, 2009

Household Income Blues...

The Census released (hat tip Calculated Risk) data for 2008 Household Income and it was a doozy...

The U.S. Census Bureau announced today that real median household income in the United States fell 3.6 percent between 2007 and 2008, from $52,163 to $50,303. This breaks a string of three years of annual income increases and coincides with the recession that started in December 2007.
Even more remarkable is that EVERY income limit (i.e. bottom 20% through top 20% and top 5%) is now down in real terms since 1999!

Household Income by Limits

And the bottom 20% bracket now earns a WHOPPING $2689 more per year in 2008 dollars than in 1968.

Cumulative Change in Household Income

Source: Census