If there is a lot of overlap between your portfolio and the market, there is only so much alpha you can earn. This is obvious. Still, when you visualize this potential it sends a powerful message. Active share—the preferred measure of how different a portfolio is from its benchmark—is not a predictor of future performance, but it is a good indicator of any strategy’s potential excess return.
You don't always get what you pay for
Using Morningstar Large Blend category data (the most plain vanilla of the plain vanilla), the below charts look at the relationship between fund expenses and active share for funds with active share > 20 to see what an investor is actually paying for. I narrowed the universe down further to funds benchmarked against the S&P 500 and then I did my best to strip out funds with style tilts (i.e. there were some growth, value, and dividend funds that fell in the category). One issue that remains is the below is screened by oldest share class to exclude duplicates, so there is some apples to oranges comparisons going on in terms of share class (though almost all of the funds are A share).
The first chart highlights the weak relationship between expenses charged and active share provided. An extreme example that was stripped out of the analysis that I came across was an S&P 500 index fund charging 1.60% with a 4.75% load.
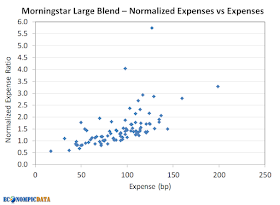
The second chart compares the expense ratio against expenses normalized for active share (i.e. expenses charged divided by active share). Given the weak relationship between expenses and active share from the first chart, it should be no surprise that higher expenses generally mean higher normalized expenses too. This is a reason why funds with higher fees are less likely to outperform than funds with lower fees... investors are generally not getting a higher active share product for those higher costs.
Things get more interesting when you compare normalized expenses against active share. Here you can clearly see that the normalized expense ratio generally moves lower as active share increases. In fact, some of the cheapest normalized funds are those that have a much higher active share and may charge a slight premium.
Taking advantage of the "fungibility" of funds
While active share is a good indicator of a strategy's potential excess return gross of fees, an investor may not want to take as much relative risk or pay the fees embedded in the highest active share products. The good news is an investor can create a lower cost / lower active share solution through an allocation to higher active share managers and index funds... even if the cost may initially appear slightly higher in absolute terms.
For example... assuming an investor believes the capabilities of manager A and B are identical and has a 20% active share target. Yet:
- Manager A costs 50 bps for 20% active share = 50/20 = 2.5 bp normalized expense ratio
- Manager B costs 100 bps for 50% active share = 100/50 = 2.0 bp normalized expense ratio
Takeaway
When choosing an active manager, confidence in the team, the process, and the discipline the team has in following that process through various market cycles continues to be of obvious importance. As important is not the cost you pay in absolute terms, but rather what you pay for each unit of the skill they are selling.


