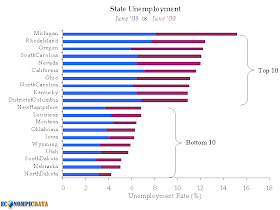
Michigan again reported the highest jobless rate, 15.2 percent, in June. (The last state to have an unemployment rate of 15.0 percent or higher was West Virginia in March 1984.) The states with the next highest rates were Rhode Island, 12.4 percent; Oregon, 12.2 percent; South Carolina, 12.1 percent; Nevada, 12.0 percent; California, 11.6 percent; Ohio, 11.1 percent; and North Carolina, 11.0 percent. The Nevada, Rhode Island, and South Carolina rates were the highest on record for those states. Florida, at 10.6 percent, Georgia, at 10.1 percent, and Delaware, at 8.4 percent, also posted series highs.Below is a chart of the highest and lowest 10 unemployment rates among states (and districts - i.e. Washington D.C.).

We can see that Michigan, with its focus on the manufacturing sector, has been negatively impacted to a greater extent than the rest of the United States with unemployment in excess of 15%. Not too far behind in the standings is California, where the issues emanate from the housing bubble, at 6th highest.
Looking deeper into these two states, we see how they have each fared since 1976 against the country as a whole.

A few data points do not make a new trend, but California was the first to see issues with the housing bubble and over the past few months has shown relative strength (or is it that the rest of the country is just catching up), whereas Michigan's problems continue to worsen.

Source: BLS

The first graph is unreadable. You need to make it higher resolution.
ReplyDeletefixed...
ReplyDelete