In fact, since 1976, U.S. stocks and bonds have not declined at the same time for more than two consecutive months. Over the last 60 years, there’s only been one year in which both stocks and bonds posted an annual decline (1969).You can actually make a bolder statement than that given that the Barclays US Aggregate Index' inception wasn't until 1976. The S&P 500 and "Agg" have never declined at the same time for more than two consecutive months. As surprising to me was that stocks and bonds on a stand-alone basis have only declined more than two straight months about 5% of the time (i.e. once every year and eights months).
Jeremy Schwartz (@JeremyDSchwartz) outlined a few months back during a back and forth that stocks (especially small cap stocks) have historically performed very well during periods of rising rates... going back all the way to the 1950's.
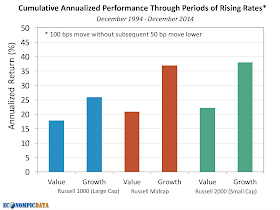
Taking that one step further, the below breaks out performance by small, mid, large across value and growth during periods of rising rates since 1994 (I can only get daily Russell data going back 20 years). In this case, rising rates is defined as periods where the 10 year Treasury rose more than 100 bps without a 50 bp decline (there have been 9 such periods since 1994). Not only have stocks broadly performed exceptionally well in these periods (with small caps outperforming), growth stocks have performed even better (the less "bond-like" the stocks, the better the performance in rising rate environments).
Source: Russell, S&P, Barclays


No comments:
Post a Comment