Sunday, October 31, 2010

Rebalance

The WSJ (hat tip The Big Picture) with some faulty numbers:
Advisers, too, have been buying higher and selling lower. Those who use TD Ameritrade had an average of 26% of clients’ assets in bonds and cash on Oct. 9, 2007, the day the Dow Jones Industrial Average hit its all-time high of 14164.53. By March 9, 2009, the day the Dow scraped rock bottom at 6440.08, the advisers had jacked up bonds and cash to 51%.”
Barry piles on:
The simple explanation is that advisers (or at least the bulk of them) are reacting emotionally to market swings. They are over-confident after markets have had big moves up, so that’s when they buy; they dump equity shares in a panic late in a down turn.
Does Ameritrade even provide investment advice? Either way, the numbers shown above don't exactly make the case that these investors were buying high and selling low.

Why?

First take a look at performance of equities and fixed income since that October 9th period.


The relevance?

Ameritrade investors weren't buying high and selling low, they were doing what investors have been told to do... "buying and holding". A passive investor with a 26% allocation to fixed income (i.e. the starting point) would have had a 47% allocation to fixed income on March 9th, 2009 (equities sold off more than fixed income, thus increasing the allocation to fixed income). Very close to the allocation detailed in the WSJ article.


So rather than an article that headlines why investors should be wary of advisers because they are over-confident, perhaps the data shows that investors should simply have advisers that aren't scared to provide advice and can share one of the easiest investment lessons... the power of rebalancing.

Source: Yahoo Finance

Friday, October 29, 2010

More on GDP

The chart below shows the draw down (the percent below the previous peak) of each sub-component of GDP (C + I + G + NX - NI). What this shows is that while things are bouncing back, outside of government spending all other areas are still below their previous peak (consumption is slightly down).


All four of these sub-components have been below the previous peak for 9 straight quarters. Is this really so different?

Compared to the last three recessions... yes.

During the early 00's recession we only had this happen during one quarter, during the early 90's recession this didn't happen once, and during the early 80'd we saw a similar situation for about 2 quarters. We have to go back to the recession of the mid 1970's when this situation occurred 11 straight quarters.

During that time there was stagflation, which is not a good thing, but at least it prevented nominal debt from accumulating in real terms; not the case during the most recent disinflationary period.

Source: BEA

GDP Bounces... Still Below Trend

The WSJ details:
The U.S. economy expanded at a slightly faster pace in the third quarter as consumer spending inched up, but growth remains too weak to cut unemployment any time soon.

Gross domestic product, the value of all goods and services produced, rose at an annual rate of 2.0% after climbing 1.7% in the second quarter, the Commerce Department said Friday. Economists polled by Dow Jones Newswires were expecting GDP to rise by 2.1% in the July to September period.

The government report was the last significant economic indicator before midterm elections Nov. 2 and a Federal Reserve meeting ending Nov. 3. More than a year after the recession ended, stubbornly high unemployment could hurt Democrats in Congress and is likely to be a key factor in getting the Fed to resume bond purchases.

The GDP breakdown showed that spending by Americans, accounting for about 70% of demand in the U.S. economy, rose at a 2.6% rate. That's up from a 2.2% increase in the April to June period and a 1.9% in the first quarter.


Source: BEA

Thursday, October 28, 2010

What is So F'n Funny?

WSJ (hat tip Infectious Greed) details:

Before settling in Sunday for your 10-hour NFL binge, there's a pretty good chance you'll watch the hour-long pregame shows. There's also a pretty good chance you'll notice something slightly odd about their hosts: They never stop laughing.


Source: WSJ

Equities Poised for Breakout?

Marketwatch (hat tip Crossing Wall Street):

In all, with roughly half of the S&P 500 reporting by Wednesday, 81% had exceeded expectations, with just 13% coming up short, according to data compiled by Thomson Reuters.

If that percentage holds, it would be the highest level of companies beating estimates in a quarter ever — or a least since Thomson Reuters began tracking them 16 years ago. It would top even the 79% mark hit in the third quarter of 2009, when the economy came off the absolute rock bottom of late 2008.

Earnings beats are great, but earnings are only important relative to the price of those earnings (i.e. P/E or the inverse... earnings yield). The below looks at earnings yield by quarter (annualized) relative to the index (note that Q3 is an estimate) and things look pretty... pretty... good.


The question has been whether these earnings are sustainable. To get a glimpse, the above also shows sales relative to the price level of the index. While things don't look as rosy, they still look much improved from the richness seen over the past decade.

Source: S&P

Wednesday, October 27, 2010

End of the Bond Bull Market

Lets take a quick look at the Treasury market over the past 15 years.


Bull run?

Absolutely (i.e. rates have trended down for a long time).

The end of a bull run?

In other words, can you expect capital appreciation to provide returns in excess of the yield? No... so yes, an end of a bull run.

Is Jake an "investor" in Treasuries?

Not at all. I'll detail my current investment strategy another day, but it mainly involves betting against ETF's and ETN's that "attack".

Why?

Jake (a patient investor with no specific benchmark or liabilities) believes he can do better waiting for the next opportunity (even if it means speaking in third person under a pseudonym).

So given all of that... longer duration Treasuries are rich... right?

Not necessarily. As I detailed in Yield Wins in the Long Run, a 2.7% 10 year and 4.03% 30 year yield simply means that investors should expect a nominal return of 2.7% and 4.03% for the duration of that type of investment (currently around 8.5 years for a 10 year Treasury and 17 years for a 30 year Treasury). BUT, as described in the posts On the Value of Treasuries and Investing in a Low Return Environment there is a strong possibility (in my opinion) that these yields may simply reflect a period of stagnant growth and disinflation.

So, a good investment? If there is inflation... heck no. Deflation... heck yes.

Conclusion

Uncertainty and until I have some, I'll be yet again be (mainly) sitting on the sideline.

Source: Federal Reserve

QE Disappoints?

Bloomberg details:

“The market is consumed with QE,” said John Spinello, chief technical strategist in New York at Jefferies Group Inc., one of 18 primary dealers that trade with the Fed. “There are indications that the marketplace is disappointed at the fact that it’s more than likely not going to be a huge initial undertaking and no one knows the amount.”

Is the daily performance the result of this lack of QE?


Or perhaps investors have realized a 10-20% run up in risk assets / real assets in a month (due to QEII) is a bit ridiculuous...

Source: Yahoo

Tuesday, October 26, 2010

Housing Rebound Stalls

The Case Shiller home price index since August 2000. Rocky rode, but up ~36% (3.1% annualized) since August 2000. To put that in perspective, that compares to a 25% increase (2.3% annualized) in CPI.


Source: S&P

Monday, October 25, 2010

On the Value of High Yield

Back in June in a post titled Zombie Nation EconomPic relayed:
Low interest rates are allowing zombie corporations to stick around (i.e. their business models may be dead, the economic environment may be dead, but low financing costs allow them to remain "alive"). But why would someone invest in a company that just a living dead entity?

Investors are willing to take the risk due to the perceived relative value of high yield issuers.
Bloomberg provide the update:
The lowest-rated junk bonds are the most expensive corporate debt following a Federal Reserve- induced rally in high-risk assets, adding to concern fixed- income securities are overvalued.

The extra yield investors demand to hold global bonds rated CCC or lower instead of government debt is about 10.2 percentage points, or 3.3 percentage points narrower than the average over the past 12 years, according to Bank of America Merrill Lynch index data. Debt with B ratings is the only other part of the market trading tighter than its historical average.

Record-low interest rates in the U.S. and Europe, and speculation the Fed will purchase more bonds to keep the economy from faltering, are encouraging debt investors to take on riskier securities and stoking concern prices are rising to unsustainable levels.
I personally don't see the Fed letting off the gas pedal anytime soon, but beware of the impact on liquidity fueled performance when they do.


Source: Barclays Capital

MSFT vs. AAPL Earnings

Ahead of this Thursdays Microsoft earnings (consensus is at 55 cents / share or ~$4.76 billion), a comparison of Microsoft's quarterly earnings (in billions) to Apple's.


I'll leave the fundamental analysis for those smarter than me, but as can be seen:

1) Microsoft still out-earns Apple
2) That earnings gap is decreasing rapidly as Apple's earnings growth have been nothing short of astronomical
3) Microsoft earnings have been nothing to sneeze at, up more than 13% annualized over the past four years (June '10 vs June '06) despite the economic slowdown
4) You can buy a dollar of Microsoft earnings for a bit more than $12 or about half the price of Apple's (this does not make Apple rich; it just means Apple better keep growing at a fast clip)

Source: Daily Finance

Leading Economic Indicators Continue to Point Up

NPR reports:

The Conference Board, a private research group, said Thursday that its index of leading economic indicators increased 0.3 percent last month. It edged up 0.1 percent in August, slower than the initial 0.3 percent estimate.

The index had grown steeply since April 2009 on the strength of the stock market, record-low interest rates and a rebound in manufacturing. But the rate of expansion tapered off this summer as U.S. economic growth slowed.

A continued rise due to monetary policy (money supply, interest rate spread, and stock prices) offset (in part) by the actual economy.


Source: Conference Board

When 9.6% Growth Isn't Enough

Marketwatch details:
China's economic growth slowed to 9.6% in the third quarter from the same period a year earlier, the National Bureau of Statistics reported Thursday. The result compared to 10.3% growth in the second quarter and was just slightly above a 9.5% average forecast from a survey reported by Dow Jones Newswires. Consumer prices for September rose 3.6% year-on-year, as expected by the Dow Jones survey, ticking up from a 3.5% gain in August. Producer prices were up 4.3%, matching August's increase and coming in above a 4.1% forecast.


Looking at the chart above, we see that this time may be different. Over the past ten years of remarkable Chinese growth there has not been an instance when GDP was trending down and inflation was trending up. Hence, although growing at a strong 9.6% clip, China has a real balancing act to deal with.

Wednesday, October 20, 2010

Time to Pat Myself on the Back...

Bloomberg reports the TARP bailout actually made money:
The U.S. government’s bailout of financial firms through the Troubled Asset Relief Program provided taxpayers with higher returns than yields paid on 30- year Treasury bonds -- enough money to fund the Securities and Exchange Commission for the next two decades.

The government has earned $25.2 billion on its investment of $309 billion in banks and insurance companies, an 8.2 percent return over two years, according to data compiled by Bloomberg. That beat U.S. Treasuries, high-yield savings accounts, money- market funds and certificates of deposit.

Back in an October 2nd, 2008 post titled Bailout Can Work and at No Cost to Taxpayers I concluded:
The bailout will not solve all the economic problems we are currently facing. In fact, not even close. We still have a massive amount of leverage in the system that needs to be unwound. However, if this bailout is done right, it should help unfreeze credit markets (which are currently non-functioning) at little or no cost to taxpayers.
More here and back to normal broadcasting (I promise)...

The Importance of the Emerging World

I think the below clearly illustrates the importance of the emerging world and relative decline in the importance of the developed world. Not only are they growing faster, but they are a much larger (and growing) percent of the world's population.


Source: Eurostat

Look Out for Eastern Europe

Missed this last week... Extremely strong industrial production out of eastern Europe...


A few points...

The Good
  • It seems that everyone had been counting out Eastern Europe (including me)
  • The European Union "should" allow lower GDP per capita countries (i.e. Eastern Europe) outpace higher GDP per capita countries simply by utilizing new technologies / open trade

The Bad

  • The above chart shows the rebound off a large collapse, so it remains to be seen if this is a rebound or the start of a longer trend
  • The above was before the Euro spiked up 15-20%, so we'll see if the drag of a stronger currency on exports impacts these countries

Source: Eurostat

Tuesday, October 19, 2010

Commercial Real Estate Collapse Continues

WSJ details:

U.S. commercial real estate prices fell 3.3% in August from a month earlier, putting prices at 2002 levels after a third straight month of declines, Moody's Investors Service said Tuesday.

Prices for office buildings, shopping centers and apartment complexes are now down 45% from their late-2007 peak, said Moody's. Rental demand has diminished, shrinking properties' cash flow, while a tighter financing market has restricted investors' ability to inflate their returns using leverage.

The decline in nominal terms is to 2002 levels. In real terms... we are at pre-index levels.


Source: MIT / BLS

Monday, October 18, 2010

China Hearts US Treasuries

Maybe they don't heart Treasuries, but with a soaring trade deficit they don't have much of a choice if they want to keep the Yuan cheap. The FT details the broader demand for Treasuries:
Foreign investors scooped a near record amount of US debt in August and sharply increased their holdings of Treasury bonds, according to the latest Treasury International Capital report.

August was marked by fears that the US economy faced a possible double dip recession and yields on Treasury bonds fell sharply as bond investors priced in a move by the Federal Reserve to start another round of quantitative easing. The Fed announced in August that it would start reinvesting principal payments from its agency debt and agency mortgage-backed securities in longer-term Treasury securities.
And China is by far the biggest foreign buyer. Over the last 12 months, China has purchased more than 40% of the marginal increase in foreign Treasury holdings assuming that purchases of the United Kingdom are in fact simply Chinese purchases (see here for more on why the bulk of the UK jump is in fact Chinese purchases).


Source: Treasury

Gold over the LONG Run

A follow up from last week's post "A View from the Gold Perspective", the chart below shows the price of consumer goods / services in gold terms since 1800. As I mentioned in my previous post (and can be seen below):
The Great Depression was a deflationary environment as the dollar was backed by gold. Today, rather than deflation in dollar and gold terms, we have a disconnect between the dollar (slight inflation) and gold (massive deflation) in terms of goods / services.


Source: Minn Fed / Measuring Worth

Empire Manufacturing Jumps

I can't remember... is good news good because it's good or bad because less bad means less stimulus? Either way, this appears to be good.

Marketwatch reports solid manufacturing data out of New York:

Conditions for New York state manufacturers improved markedly in October, according to a report released Friday morning.

The New York Fed’s Empire State manufacturing survey jumped nearly 12 points to 15.7. Economists polled by MarketWatch expected the gauge to climb to 6.5 from 4.1 in September.

The New York Fed said it’s a clear gain over the relatively low but positive readings seen from July through September. Fewer respondents said conditions had worsened, and the new orders index moved higher. The shipments index rose above zero, climbing 20 points to 19.4.


Source: NY Fed

Threat of Consumer Disinflation Continues... Here Comes Ben

BusinessWeek details the (lack of) inflation:
The cost of living in the U.S. rose less than forecast in September, indicating limited consumer demand is making it difficult for companies to raise prices.

The consumer-price index rose 0.1 percent after 0.3 percent gains in the prior two months, figures from the Labor Department showed today in Washington. Economists projected a 0.2 percent gain, according to the median forecast in a Bloomberg News survey. Excluding volatile food and fuel costs, the so-called core rate was unchanged for a second month.
Outside of energy, which has much lower year over year increases (with the financial crisis induced collapse, which one year later appeared as a spike) rolling off, consumer inflation (with the exception perhaps of the recent run up in food prices) is nowhere to be found.


Which leads us to Bernanke's latest speech per Bloomberg:
Federal Reserve Chairman Ben S. Bernanke said additional monetary stimulus may be warranted because inflation is too low and unemployment is too high.

“There would appear -- all else being equal -- to be a case for further action,” Bernanke said today in the text of remarks given at a Boston Fed conference. He said the central bank could expand asset purchases or change the language in its statement, while saying “nonconventional policies have costs and limitations that must be taken into account in judging whether and how aggressively they should be used.”

He didn’t offer new details on how the Fed would undertake those strategies or give assurances the central bank will act at its Nov. 2-3 meeting.

Bernanke and his central bank colleagues are considering ways they can stimulate the economy as the unemployment rate holds near 10 percent and inflation falls short of their goals. After lowering interest rates almost to zero and purchasing $1.7 trillion of securities, policy makers are discussing expanding the Fed’s balance sheet by purchasing Treasuries and strategies for raising inflation expectations, according to the minutes of the Federal Open Market Committee’s Sept. 21 meeting.
Source: BLS

Thursday, October 14, 2010

PPI: Headline - Core Diverge

Marketwatch details:

U.S. wholesale prices jumped 0.4% in September, mainly because of higher meat and natural gas costs, the government reported Thursday.

Core producer prices, which exclude the volatile food and energy categories, rose 0.1%. The core number tends to draw the most attention of economists.

After the report on wholesale prices as well as rising weekly jobless claims and a growing trade deficit, both bonds and stocks fell. See story on jobless claims.

The Fed is unlikely to let the report stand in the way of another round of bond purchases, economists said.

“Over the last ten months, core prices have increased 0.1% seven times, hardly sufficient to warrant concerns about inflation,” said Dan Greenhaus, chief economic strategist at Miller Tabak.

My expectation is that the gap between headline and core PPI will continue to grow as the weak dollar will continue to cause commodities (input) prices to rise, whiel the muddle through economy will weigh on the ability to pass-through these price increases.


Source: BLS

Is China Really the Issue?

The WSJ details:

China's monthly trade surplus narrowed to its lowest level in five months in September, official data showed Wednesday, as commodity imports staged an unexpected rebound and export growth continued to slow.

Even after declining to $16.88 billion in September from $20.03 billion in August, China's trade surplus is still substantial, and the latest data aren't likely to substantially alleviate friction between China and its major trading partners. Last month, the U.S. House of Representatives passed a bill that would penalize China for its exchange rate policy, and on Tuesday, U.S. Treasury Secretary Timothy Geithner said the U.S. wants to make sure the yuan appreciates "at a gradual but still significant rate."

China's exports grew 25.1% from a year earlier in September, down from August's 34.4% expansion, data from the General Administration of Customs showed on Wednesday. Imports rose 24.1% from a year earlier, down from August's 35.5% increase. Economists had expected exports to rise by 26.0% and imports to rise by 25.0%.

Now for the contrarian view... A simple Q&A:

  • Are Chinese exports significantly higher than their imports? Yes
  • Do China's imports (commodities) consist of items exported from the U.S.? No
Both of which cause political issues for China from the U.S. BUT, in looking at overall levels of imports relative to that of the U.S., China imports MUCH more than I would have guessed and has become an increasingly large global player in a VERY short time.


Source: Haver

Trade Imbalance Increases

Bloomberg details:

The trade deficit widened more than forecast in August as growing U.S. demand for foreign autos and capital equipment swamped gains in exports.

The gap grew 8.8 percent to $46.3 billion, exceeding the $44 billion median forecast of economists surveyed by Bloomberg News, Commerce Department figures showed today in Washington. Imports rose 2.1 percent, while exports increased 0.2 percent.

The result is that net exports will continue to be a drag on GDP, but the optimist would note that the most recent datapoint (August) was before the collapse in the US dollar, which should (all else equal) make U.S. goods / services more attractive (i.e. cheaper) to foreign businesses / consumers. The opposite point of view on this is that it will simply cause the imports we need (i.e. low cost consumer goods from China / petroleum) to be more expensive.


Source: Census

Wednesday, October 13, 2010

We're #7! We're #7!

Zerohedge details:
While the US was #1 10 years ago, due to an abysmal growth rate of only 23%, by far the lowest of all the ranked countries, the US has now dropped from first to seventh, falling behind such countries as Sweden and France.
While the US was in fact still a distant #2 behind Switzerland in 2000 (60% less for the Swiss was $232k / head, while 23% less for the US was $192k), the relative results since 2000 are still rather sobering.


Source: Credit Suisse

Employment, Productivity, and Economic Growth

The economy can grow one of two ways... an increase in the number of people working (i.e. employment) or getting more out of these workers (i.e. productivity). Over the last few years the employment side has been horrendous, but has been (partially) offset by a jump in productivity (i.e. getting more out of the existing workforce).


The issue (as I see it) is the longer trend that can be seen above. Employment has been on a 30 year slowdown in terms of growth, while productivity has just recently slowed following a 20+ year period from a consistent rise from the early 80's through early 00's (lack of investment?).

Source: BLS / BEA

Tuesday, October 12, 2010

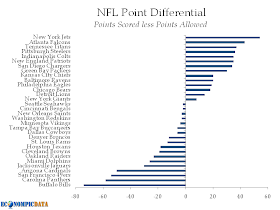
J-E-T-S

My J-E-T-S are dominating, but the most shocking thing about the below chart is that the Arizona Cardinals are 3-2. and the Chargers are 2-3. There must be some sort of investing analogy in this...

Click for Larger Image


Source: ESPN

Wall Street: The Market Environment Weak But SHOW ME THE MONEY

Dealbook reports:

Despite everything, Wall Street salaries are still on track to reach a record high for the second year in a row, a study by The Wall Street Journal has revealed.

Compensation appears to be going up faster than bank revenue, according to the report, with a pay increase of four percent, from $139 billion in 2009 to $144 billion in 2010, across the 35 firms surveyed by The Journal.
Bloomberg follows that expectations from employees are high, despite the less-than-stellar environment (bold mine):

Half of Wall Street finance professionals surveyed expect their bonuses to increase for 2010, eFinancialCareers.com found.

About 71 percent of the 2,145 people who responded to the e-mailed poll in the U.S. said they are anticipating at least an equal bonus from last year, with 50 percent expecting a bigger payout, the job-search website said in a statement. About 11 percent said their bonus will jump by at least half, according to the survey.

The percentage expecting a bigger bonus increased from 36 percent in last year’s poll, when firms faced pressure from regulators and lawmakers to rein in pay after many accepted billions in government rescue funds. Almost 60 percent of respondents cited market conditions as the biggest concern for their compensation.


So why pay?

“The signs of bonus euphoria may be hard to find, but Wall Street employers will have to deal with professionals who believe they are in contention for fatter paychecks and the inevitable retention issues should their expectations be dashed,” Constance Melrose, managing director of eFinancialCareers North America, said in the statement.
Ah... we're back to the good old days (pay because they deserve it when times are good - pay or they leave when times are bad). Lets break out the old Wall Street Bonus Matrix.


Actually, did they ever change?

A View from the "Gold Perspective"

A reader of Crossing Wall Street blog responds to Eddy's gold model post (which I looked into here) and puts everything in terms of gold, rather than dollars. Note that this is just a portion of that response and I recommend readers take the time to read the whole thing and think about it as it puts everything in a very different perspective. That response:
First, the dollar derives its value from its relationship to gold. So instead of the dollar price of an ounce of gold, it should be thought of as the gold price of a single dollar. (For instance, the current of gold price of single US dollar is presently about 1/1345th of an ounce of gold)

Second, on this basis, the relationship is somewhat clearer: when the purchasing power of an ounce of gold rises (i.e., when an ounce of gold commands more dollars) interest rates will be low; and, when the purchasing power of a an ounce of gold falls (i.e., when gold commands fewer dollars the interest rate will be high).
In other words... gold doesn't rise in dollar terms when real interest rates are low (or negative), but rather interest rates are low because their is no demand for the dollar in gold terms.

A View from the "Gold Perspective"


Under the assumption that Gold IS the only real currency (it has the huge benefit that it cannot be depreciated - an ounce of gold in year 1 is an ounce of gold in year 2, year 3, ... year 100), then the recent run up in gold is not appreciation relative to the dollar, but rather the US dollar has seen a severe depreciation relative to real currency (i.e. gold).

But, if the dollar is collapsing, then why aren't prices of goods and services jumping?

Perhaps (bear with me, this perspective is new to me) we happen to be in a severe deflationary environment in real currency (i.e. gold) terms, offset (intentionally?) by a devaluation of our fiat currency to prevent a collapse in the price level of goods in $$ terms. This devaluation may be saving the economy from falling into a deflationary spiral if not pursued (our economy has a lot of hard assets that are used as collateral for dollar loans. A drop in the assets value would be extremely destructive as the value of these loans would fall if the price of the collateral was allowed to fall, which would cause asset prices to fall further... rinse - repeat).

The Great Depression was a deflationary environment as the dollar was backed by gold. Today, rather than deflation in dollar and gold terms, we have a disconnect between the dollar (slight inflation) and gold (massive deflation) in terms of goods / services.

Below is a chart of headline CPI (i.e. purchasing power of the dollar) vs. gold CPI (purchasing power in gold terms). Since the consumer price index began in 1947, goods / services cost ~900% more whereas goods / services cost 70%+ less in gold terms.


And a year by year comparison of CPI in dollar terms and gold terms shows the economy went "gold deflationary" during the telecom / Internet induced recession early last decade.


Still getting my head around this, but any comments are more than appreciated...

Source: Measuring Worth / BLS

Monday, October 11, 2010

How's the Box Office Doing?

The impact of 3D (higher revenues) vs. the impact of HDTV / Netflix (staying at home).


Source: BoxOffice Mojo

Corporate Bond Performance

Year to date performance of corporate bonds (investment grade rated bonds AAA --> BBB / high yield bonds rated below BBB) is shown below. What is rather (in my opinion) amazing is that the top performing corporate bond quality by rating (BB) are up only ~4% from the bottom performing corporate bond quality by rating (AA).


Why amazing? Take a look at the below, which details the top performing corporate bond quality by rating and the bottom.


Some initial thoughts that come to mind...

The Fed has been performing a balancing act due to the slow down in
growth (i.e. when high quality assets "should" outperform) by providing a TON of liquidity (i.e. when low quality assets "should" outperform). The fact that all corporate bonds by quality are performing relatively in-line (and doing well in absolute terms) shows me that the Fed is doing their job quite well or that the market does not know how to interpret what they are doing, thus not differentiating between high and low quality (I am inclined to think the latter).

And because I was digging through data... some longer term analysis of the various quality by rating of corporate bonds (annualized performance vs. annual volatility). Broadly, more risk = more return until an investor reaches too much for yield (below BB). Note that information ratio below is defined as excess risk to T-Bills / annual volatility.


Source: Barclays Capital

QE Response Has Been Strong

Since QE was hinted at on September 21st, most assets have done quite well.


Though as I noted yesterday, it looks much more like a dollar sell-off than anything else as the Euro has rallied by more than all the sectors above with the exception of oil (i.e. valuations haven't moved or have actually declined in non-dollar terms).

But I guess that's the point...

Source: Yahoo

A Nation of "Slackers"

Part time workers for slack business conditions that is.


Source: BLS

Employment Bifurcation: Government Down - Private Sector Up

Growth in the private sector wasn't amazing, but there was growth. That growth was dwarfed by state level austerity and the roll-off of census workers.

The AP details:
A wave of government layoffs last month outpaced weak hiring in the private sector, pushing down the nation's payrolls by a net total of 95,000 jobs.

The Labor Department says the unemployment rate held at 9.6 percent. The jobless rate has now topped 9.5 percent for 14 straight months, the longest stretch since the 1930s.

The private sector added 64,000 jobs, the weakest showing since June.

Local governments cut 76,000 jobs last month, most of them in education. That's the largest cut by local governments in 28 years. And, 77,000 temporary census jobs ended in September.
Broader unemployment has reversed course and again heads higher.


The household survey did show some signs of life (for women at least) at the expense of the teen worker, which is becoming extinct.


Source: BLS

Thursday, October 7, 2010

Consumer Credit Breakdown

Reuters details:
Total consumer credit outstanding declined for the seventh straight month in August as credit card debt continued to fall.

The Federal Reserve said on Thursday total outstanding credit, which covers everything from car loans to credit cards, fell by $3.34 billion after dropping $4.09 billion in July.
Looking a bit longer term, we see how the composition of those debt "holders" has changed.


Commercial banks had to take loans that were hidden off-balance sheet... back (though the combined level of securitized + commercial loans continues to default contract) and the government continues to take on more credit risk (up more than $150 billion over the past three years) in an attempt to stimulate the economy / pump $$ back into banks.

Source: Federal Reserve

Equity Rally or Dollar Sell-Off

The recent (since June) equity rally looks awfully tame / non-existent in Euro terms.


Source: Yahoo

On the Value of Gold

I've been a gold bull for a while now (see my post Ready to Ride the Golden Bubble from March 2009), but my rationale was more behavioral in nature. But now, Crossing Wall Street has a fascinating post on a possible model (or at least a framework) for the price of gold, which indicates we are nowhere near the peak.

I highly recommend reading the full post as it provides a nice background for why the model may work, but to the magic formula:
Whenever the dollar’s real short-term interest rate is below 2%, gold rallies. Whenever the real short-term rate is above 2%, the price of gold falls. Gold holds steady at the equilibrium rate of 2%. It’s my contention that this was what the Gibson Paradox was all about since the price of gold was tied to the general price level.

Now here’s the kicker: there’s a lot of volatility in this relationship. According to my backtest, for every one percentage point real rates differ from 2%, gold moves by eight times that amount per year. So if the real rates are at 1%, gold will move up at an 8% annualized rate. If real rates are at 0%, then gold will move up at a 16% rate (that’s been about the story for the past decade). Conversely, if the real rate jumps to 3%, then gold will drop at an 8% rate.
I wanted to see for myself, so I took Eddy's model and updated real T-Bill rates with historical T-Bills rates and historical CPI figures going back to 1950, then sized it so the output matched the current price of gold.

And while he is not trying to explain 100% of gold's movement, but rather the factors that drive that movement... the result in itself is rather impressive to say the least.


Log Scale


His six takeaways (summarized):
  1. Gold isn’t tied to inflation, but rather tied to low real rates (not always one in the same)
  2. When real rates are low, the price of gold can rise very, very rapidly
  3. When real rates are high, gold can fall very, very quickly
  4. Gold should not (and does not) have a long-term relationship with equities
  5. Low rates are likely to last for a long period of time
  6. Gold price is political; central bankers can crush the price if desired (i.e. raise rates)
This last point intrigues me. There is so much capital wasted (i.e. invested) in gold that my question is what would happen if central bankers did just that and raised rates?

The common thought (mine included) is that would kill the economy as we do live in a "credit economy" (i.e. there are lots of assets that are priced based on cheap credit, such as housing). But what if that forced capital away from gold and into goods and/or services that actually benefitted someone / something in the economy?

Data Source: Measuring Worth
Model Data (column K): Google Docs

Wednesday, October 6, 2010

Race to the Bottom

Reuters details:
U.S. Treasuries rose broadly and the five-year yield hit a record low on Wednesday, supported by prospects of further monetary easing by the U.S. Federal Reserve.

* The five-year Treasuries yield fell to a record low of 1.179 percent at one point.

* Treasuries have been supported by market expectations that the Fed could unveil a second round of quantitative easing as early as November and make new purchases of Treasuries.

* An additional factor supporting Treasuries was a rally in Japanese government bonds in the wake of the Bank of Japan's decision on Tuesday to ease monetary policy, said a trader for a European brokerage house.


Sean from Dead Cats Bouncing details the why:
The purpose of QE is to increase inflation expectations and support growth, so success would be reflected in the long-run real rate (a proxy for real trend GDP growth) to mean-revert back towards the 2-2.5% range as happened in 2009.

The inflation expectations component of yields will have to move higher if central banks start chucking hundreds of billions of new money around. In other words, even with the Fed as bond ‘buyer of last resort’, nominal yields are unsustainably low, particularly as commodity markets are on fire in anticipation.

What is remarkable is that the Fed is going nuclear when the US economy is by no means in freefall (as evidenced by yesterday’s ISM non-manufacturing survey).
He finishes with a sentence that sums this all up perfectly.
We’re heading into uncharted waters and we’re traveling at full speed.
Source: Federal Reserve

ADP Employment Rolling Over

Marketwatch details:
Employment in the U.S. private sector fell by 39,000 in September, the first drop since January, according to the ADP employment report released Wednesday. The drop surprised economists who had on average anticipated a 20,000 increase. U.S. stock futures pointed to a flat start on Wall Street after the report’s release. The ADP report suggests September nonfarm payrolls may shrink by more than the 8,000 anticipated by economists ahead of the report.
Below is the rolling three month change in goods producing and service providing jobs. As can be seen the rebound in service providing jobs is stalling and the decline in goods-producing jobs may be re-accelerating.


Source: ADP

Tuesday, October 5, 2010

Business School Unemployment

pinoymoneytalk via the Reformed Broker details:
In the past, graduates of MBA programs, especially in the US, are almost always assured of a job after graduation. The sad reality now, however, is that this is no longer true.
The below shows how depressed the job market (i.e. investment banking, consulting) for business school graduates got in 2009.


That said, these 2009 levels occurred at just about the peak of the financial crisis as business schools finished up in May 2009. Based on the recent hiring that I've witnessed, along with my belief that motivated (i.e. indebted) students are highly adaptive to new opportunities, my guess is these figures have snapped back in 2010 (albeit not to 2007 levels).

Source: BusinessWeek

Services Sector Expands... Exports Lead the Way

It will be interesting to see what a weaker dollar means to exports on a going forward basis (was this just noise or the start of something?).

What respondents are saying ...
  • "General state of the business has not changed in the last three months. The market is still soft for new sales due to financing requirements." (Construction)
  • "Business seems to be flat from last month." (Finance & Insurance)
  • "Signs that the economy may be improving, but our sector is still flat or declining." (Professional, Scientific & Technical Services)
  • "Business activity is generally stable — slightly better than last year." (Accommodation & Food Services)
  • "Third quarter is looking profitable with improving confidence and expectations in the economy. Capital expenditures are being approved." (Wholesale Trade)


Source: ISM

How Individuals are Saving

Savings are building up per Marketwatch:
Incomes grew faster than spending in August, pushing up the nation’s personal savings rate, the Commerce Department estimated Friday.

Real consumer spending increased by a seasonally adjusted 0.2% for a second straight month, the government’s data showed. In nominal terms, income rose 0.5% in August, after a 0.2% gain in July. Nominal spending rose 0.4% in August for the second straight month.

Real after-tax incomes rose 0.2% in August, after falling 0.2% in July. Incomes rose more than the 0.3% that had been forecast in a survey of economists by MarketWatch.
Here are the longer term components of savings. It looks like the growth in both income (increasing savings) and incremental spending (decreasing savings) are both bouncing back... but slowly.


Source: BEA

ISM Manufacturing Slows, but Strong

WHAT RESPONDENTS ARE SAYING ...

  • "Business results (top and bottom line) continue to meet or exceed our operating plan and exceed prior year performance by double digits." (Chemical Products)
  • "Business continues flat relative to prior month and is expected to remain flat. Commodities continue to be the main concern heading into 2011." (Food, Beverage & Tobacco Products)
  • "Our business is softening due to seasonal considerations. Overall, our situation is much better than 2009." (Machinery)
  • "Customers seem to be pulling back on orders. I suspect that they are trying to reduce their inventory for the approaching year-end." (Transportation Equipment)
  • "Strategic customers reducing order quantities." (Computer & Electronic Products)

Source: ISM